

William_Potter
This article series aims at evaluating ETFs (exchange-traded funds) regarding past performance and portfolio metrics. Reviews with updated data are posted when necessary.
RPV strategy and portfolio
Invesco S&P 500® Pure Value ETF (NYSEARCA:RPV) started investing operations on 03/01/2006 and tracks the S&P 500 Pure Value Index (SP500PV). It has 83 holdings, an expense ratio of 0.35%, and a 12-month distribution yield of 2.64%.
As described in the prospectus by Invesco, S&P 500 (SP500) stocks are assigned two scores for value and growth. The value score is based on three ratios: book-value-to-price, earnings-to-price, and sales-to-price. The growth score is based on the three-year sales per share growth, the three-year earnings yield change, and the 12-month share price return. The S&P 500 Pure Value Index selects stocks with the best value score, excluding those demonstrating both value and growth characteristics. Constituents with higher value scores receive greater weights.
In this article, RPV will be compared to iShares S&P 500 Value ETF (IVE) and SPDR® S&P 500 ETF Trust (SPY). Regarding the usual valuation ratios, RPV is much cheaper than IVE, as reported in the next table. The difference between IVE and SPY is less impressive.
|
RPV |
IVE |
SPY |
|
|
Price/Earnings TTM |
9 |
20.17 |
21.5 |
|
Price/Book |
1 |
2.5 |
3.75 |
|
Price/Sales |
0.47 |
1.76 |
2.39 |
|
Price/Cash Flow |
5.05 |
13.42 |
15.14 |
Source: Fidelity.
Financials and consumer discretionary are the heaviest sectors by far, with respectively 22% and 20% of asset value. Other sectors are below 10%. Compared to IVE and SPY, RPV overweights mostly financials, consumer discretionary and materials. It massively underweights technology and real estate.
Sector breakdown (chart: author: data: Invesco, SSGA, iShares)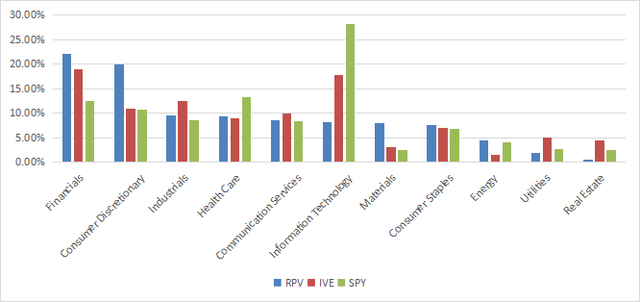
RPV portfolio includes 81 stocks. The top 10 holdings, listed in the next table, represent 23.9% of asset value. The heaviest position is below 3%, so risks related to individual stocks are low.
|
Ticker |
Name |
Weight (%) |
P/E TTM |
P/E fwd |
P/Sales TTM |
P/Book |
P/Net Free Cash Flow |
Yield% |
|
PARA |
Paramount Global |
2.85 |
N/A |
25.25 |
0.35 |
0.48 |
N/A |
1.24 |
|
GM |
General Motors Co. |
2.71 |
6.10 |
5.82 |
0.34 |
0.79 |
N/A |
0.91 |
|
PHM |
PulteGroup, Inc. |
2.58 |
6.64 |
8.22 |
1.05 |
1.88 |
18.39 |
0.83 |
|
KMX |
CarMax, Inc. |
2.55 |
28.38 |
26.64 |
0.46 |
2.24 |
127.25 |
0 |
|
F |
Ford Motor Co. |
2.52 |
21.51 |
8.68 |
0.37 |
1.46 |
N/A |
3.91 |
|
MHK |
Mohawk Industries, Inc. |
2.23 |
N/A |
10.65 |
0.56 |
0.80 |
22.09 |
0 |
|
WBD |
Warner Bros. Discovery, Inc. |
2.22 |
N/A |
N/A |
0.75 |
0.67 |
14.52 |
0 |
|
C |
Citigroup, Inc. |
2.09 |
6.53 |
7.71 |
0.76 |
0.49 |
4.00 |
4.36 |
|
LEN |
Lennar Corp. |
2.09 |
8.48 |
9.94 |
1.05 |
1.42 |
7.79 |
1.21 |
|
FDX |
FedEx Corp. |
2.02 |
16.02 |
14.22 |
0.70 |
2.42 |
43.08 |
2.03 |
Since inception, RPV has lagged SPY by 153 basis points in annualized return, and it has outperformed IVE by 33 basis points. It shows a much higher risk than the two other funds regarding maximum drawdown and historical volatility (measured as standard deviation of monthly returns).
|
Total Return |
Annual Return |
Drawdown |
Sharpe Ratio |
Volatility |
|
|
RPV |
280.02% |
8.01% |
-75.32% |
0.4 |
23.27% |
|
IVE |
260.60% |
7.68% |
-61.32% |
0.46 |
16.38% |
|
SPY |
384.82% |
9.54% |
-55.19% |
0.59 |
15.61% |
Data calculated with Portfolio123.
However, RPV has outperformed in the last 3 years (see next chart). It also beats the iShares Russell 1000 Value ETF (IWD), recently reviewed here.
RPV vs IVE, SPY, IWD, last 12 months (Seeking Alpha)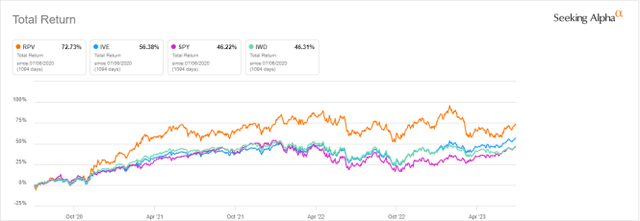
Comparing RPV with my Dashboard List model
The Dashboard List is a list of 80 stocks in the S&P 1500 index, updated every month based on a simple quantitative methodology. All stocks in the Dashboard List are cheaper than their respective industry median in Price/Earnings, Price/Sales and Price/Free Cash Flow. After this filter, the 10 companies with the highest Return on Equity in every sector are kept in the list. Some sectors are grouped together: energy with materials, communication with technology. Real estate is excluded because these valuation metrics don’t work well in this sector. I have been updating the Dashboard List every month on Seeking Alpha since December 2015, first in free-access articles, then in Quantitative Risk & Value.
The next table compares RPV performance since inception with the Dashboard List model, with a tweak: the list is reconstituted quarterly to make it comparable to a passive index.
|
Total Return |
Annual Return |
Drawdown |
Sharpe Ratio |
Volatility |
|
|
RPV |
280.02% |
8.01% |
-75.32% |
0.4 |
23.27% |
|
Dashboard List |
450.54% |
10.34% |
-55.48% |
0.53 |
19.62% |
Past performance is not a guarantee of future returns.
The Dashboard List outperforms RPV by 2.3 percentage points in annualized return, and it looks much safer regarding drawdowns and volatility. A note of caution: ETF performance is real, whereas the list is simulated.
Methodological shortcomings
I like the idea of mixing various ratios to rank value stocks. However, I think most value indexes doing so have two weaknesses, and RPV is no exception. The first one is to classify all stocks on the same criteria. It means the valuation ratios are considered comparable across sectors and industries. Obviously, they are not: my monthly dashboard here shows how valuation and quality metrics may vary across sectors. A few value ETFs have a more sophisticated approach, like Fidelity Value Factor ETF (FVAL), reviewed here, and some actively managed value funds.
The second weakness comes from the price/book ratio (P/B), which adds some risk in the strategy. Historical data show that a large group of companies with low P/B has a higher volatility and deeper drawdowns than a same-size group with low price/earnings, price/sales or price/free cash flow. The next table shows the return and risk metrics of the cheapest quarter of the S&P 500 (i.e. 125 stocks) measured in price/book, price/earnings, price/sales and price/free cash flow. The sets are reconstituted annually between 1/1/2000 and 1/1/2023 with elements in equal weight.
|
Annual Return |
Drawdown |
Sharpe Ratio |
Volatility |
|
|
Cheapest quarter in P/B |
8.54% |
-81.55% |
0.35 |
37.06% |
|
Cheapest quarter in P/E |
10.71% |
-73.62% |
0.48 |
25.01% |
|
Cheapest quarter in P/S |
12.82% |
-76.16% |
0.47 |
34.83% |
|
Cheapest quarter in P/FCF |
15.32% |
-74.77% |
0.61 |
27.03% |
Data calculated with Portfolio123.
This explains why I use P/FCF and not P/B in the Dashboard List model.
Takeaway
Invesco S&P 500 Pure Value ETF tracks a large cap value index based on three valuation metrics, including the book value to price ratio. It has lagged the benchmark S&P 500 since 2006. Moreover, it shows a much higher volatility and deeper drawdowns. The fund has outperformed in the last 3 years, but it has not brought excess return to its parent index on the long term. However, it may be very useful for swing trading, or in a tactical allocation strategy switching between value and growth styles. The portfolio overweights financials and consumer discretionary, which represent 42% of asset value together. Nonetheless, it is well-diversified across holdings. I see two shortcomings in the underlying index strategy: it ranks stocks regardless of their industries, and it relies too much on the price/book ratio, which has a bad track record.
Credit: Source link