

Eoneren
By Levi at Elliott Wave Trader; Produced with Avi Gilburt.
Back in November of last year, we highlighted a bullish setup for Infosys Limited (NYSE:INFY) to the readership. Using the NYSE-listed symbol INFY, the price was at $17.51 at the time of publication. The stock advanced up to $20.74 before beginning the current pullback. It is this pullback that can be a springboard for a move much higher in the months to come.
Let’s review Lyn Alden’s fundamental backdrop for the company. Then, we will take a look at the larger structure of price on the stock chart to see the context. But, I will give you a sneak peek – it is pointing much higher. Here are the parameters to watch.
A Review Of Lyn’s Fundamental Backdrop For Infosys
“I publicly analyzed Infosys back in February 2017 and was bullish on it. Since then, it has substantially outperformed the S&P 500.
However, part of the outperformance consists of higher valuations. I was bullish on it when it traded at the low end of its historical valuation range, but now that it’s trading at historically above-average valuations, it’s less compelling now than it was back then.
The good news is that the stock has spent the last two years correcting downward in price, which has alleviated most of the excessive valuation. I’m not sure that it’s quite at an attractive risk/reward scenario yet, but it’s back down to the realm of reasonableness, and so whenever technicals start indicating a strong uptrend is likely in place, the fundamentals would likely be supportive of that view. Until then, it remains unclear but interesting.”
Is A Strong Uptrend In Place?
It would appear so. On what do we base that assertion? First, here is the latest update from our lead analyst, Garrett Patten. He updates this and some 29 other names on a weekly basis for members in a live interactive video dedicated to these main stocks in World Markets.
“This is still sitting at the top end of retrace support as a potential wave circle ‘ii’ of a larger wave 5. This wave 5 may be taking shape as an ending diagonal with an ultimate target near as high as the 2500+ level should the entire structure play out as anticipated. There is no clear indication of a bottom yet. Even if price continues to bounce from here this might just be an ‘a’ wave of the wave ‘ii’ with the ‘b’ and ‘c’ yet to fill out.
Chart by Garrett Patten – World Market Waves – Elliott Wave Trader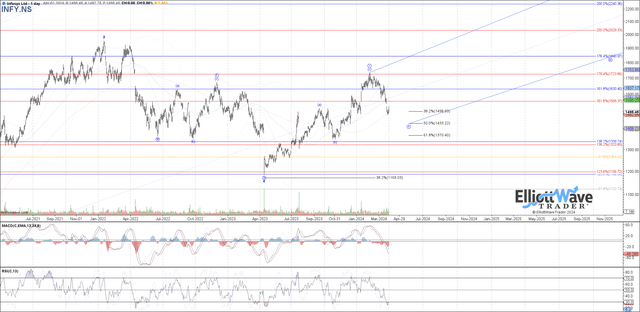
The .382 retrace is on the shallow end of standard target support within a wave ‘ii’ of a diagonal structure. More common is a retrace to the .500 or .618 retrace levels as you can see illustrated on the chart. So we may see a corrective bounce here in a ‘b’ of circle ‘ii’ and then a final move lower in wave ‘c’ of ‘ii’ to complete this correction.”
What’s The Larger Context Here?
As Avi Gilburt has shared many times Elliott Wave Theory, when correctly applied, is the only methodology that we have observed that can provide market context at any moment in time. How is this possible? Simply put, the market is fractal in nature. These forms repeat and display self-similarity at all degrees of the structure. This means that the smaller sub waves can be used to project how the larger waves will fill out.
We have a structure in INFY that seems to show a 5th wave rally underway. It also appears to be taking the shape of a larger ending diagonal. This will mean price should advance up to the 1.236 to 1.382 extension of this current wave circle ‘i’ once wave ‘ii’ finds its corrective low. That anticipated high would be wave circle ‘iii’. As we were taught early on in life, ‘iv’ follows ‘iii’ and then ‘v’ after ‘iv’ to complete the much bigger pattern the chart is showing us.
Where Would This Scenario Be Wrong?
The larger bullish scenario would not be invalidated unless price takes out the low struck in April of last year. A typical retracement, as mentioned in the commentary above, would be 50% to 62% of the move up. So, should price move under the $16 level, it would be an initial sign that we may revise our current outlook.
Why Don’t More People Use Elliott Wave Analysis?
Avi wrote an article discussing that very question. Here is a brief excerpt from that piece:
“This is a very interesting question I am asked every now and then, so I thought I would pen a response as an article.
First, many may not know this, but there are quite a few ‘name’ investors who do use Elliott Wave analysis in their decision making. One of the most popular is Paul Tudor Jones of Tudor Investment Corporation. Jones was quoted as saying that “I attribute a lot of my success to Elliott Wave Theory. It allows one to create incredibly favorable risk reward opportunities.”
But, the main question is why don’t even more use it?
Well, first let’s start with the understanding that it takes a lot of detailed work and calculation in order to perform a proper Elliott Wave analysis. Moreover, it is a very complicated method to learn. So, the entry into this methodology is not easy and to perform a proper analysis is not easy. But, then, show me anything that is truly worthwhile that does not require an initial investment and hard work.
To this end, most of what I see being claimed as Elliott Wave analysis is nothing more than what I call “wave slapping.” This is when an analyst places numbers and letters on a chart based either upon the ‘look’ of the chart, or to support their prior bias about market direction. Since I would classify most analysis presented as Elliott Wave analysis as such, resultantly, most analysis is rarely correct more than 50% of the time. And, this lends to the argument about Elliott Wave being too subjective in nature.
So, when investors follow this type of ‘analysis’ and see how often it is wrong, they make the assumption that Elliott Wave really does not work, and are turned off.”
Conclusion
Yes, there are nuances to the analysis. Once familiar with our methodology, our members discover a powerful ally on their side to provide guidance and risk management in their trading/investing.
There are many ways to analyze and track stocks and the market they form. Some are more consistent than others. For us, this method has proved the most reliable and keeps us on the right side of the trade much more often than not. Nothing is perfect in this world, but for those looking to open their eyes to a new universe of trading and investing, why not consider studying this further? It may just be one of the most illuminating projects you undertake.
(Housekeeping Matters)
If you would like notifications as to when our new articles are published, please hit the button at the bottom of the page to “Follow” us.
Credit: Source link