
Michael M. Santiago
Stock Snapshot
In today’s note, I’ll be revisiting Goldman Sachs Group (NYSE:GS) again since my September rating when I gave it a buy. Since my buy rating, the share price has gone up +16%:
GS – price since last rating (Seeking Alpha)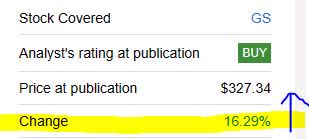
For readers who don’t follow this company much, here are a few quick facts: it is based in New York City, has roots going back to 1869, offices in all major financial capitals, and is diversified across asset and wealth management, global banking and markets, and platform solutions.
Scoring Matrix
We use a 9-point scoring method that looks at this stock holistically and assigns a total rating score, using a score matrix.
Today’s Rating
Based on the score total in the score matrix below, this stock is getting a rating of hold.
GS – score matrix (author analysis)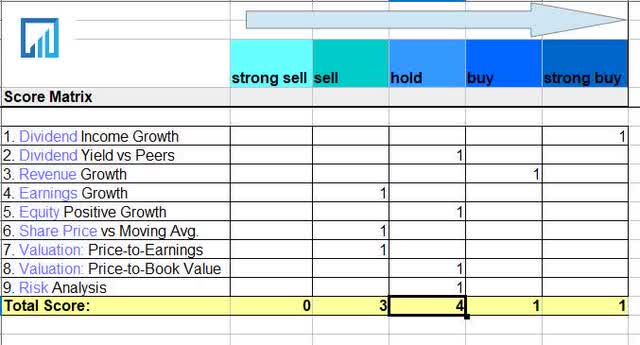
Today’s rating is a downgrade.
Compared to the consensus rating on Seeking Alpha, I am agreeing this time with analysts and the quant system.
GS – rating consensus (Seeking Alpha)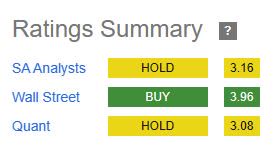
Dividend Income Growth
In this topic, I want to touch upon the 10 year dividend growth in the chart below and what it means for dividend-income investors, of which I am one.
GS – dividend growth (Seeking Alpha)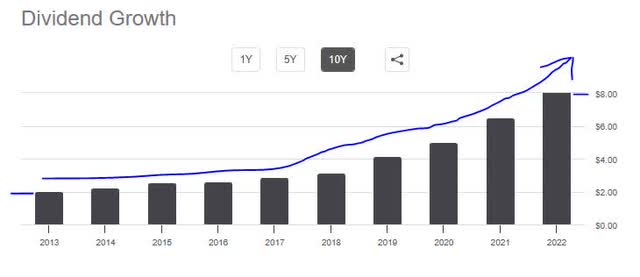
If we acquired 100 shares, as an example, when the annual dividend was $2.05 we would have seen $205 in dividend income that year, then holding shares until 2022 when the dividend was $9 and annual income of $900.
That is a +340% growth in 10 years, a pretty nice multiple in my opinion.
It has grown further in 2023, according to the history, and we can expect $10.50/yr dividend for this year ($1,050 income on 100 shares held).
In fact, according to its Q3 presentation, the company in that quarter paid out “$937MM of common stock dividends”.
Therefore, I call it a strong buy in this category, on the basis of triple-digit dividend growth over 10 years, stable payouts each quarter, and continued growth approaching 2024. This makes a great case for a dividend-income investor looking at a bank to add to their portfolio.
Dividend Yield vs Peers
Using a really convenient dividend yield comparison tool from Seeking Alpha, I created the following chart to compare the yield of Goldman Sachs against 3 other large peers in the banking sector: Charles Schwab (SCHW), Morgan Stanley (MS), and JPMorgan Chase (JPM).
GS – dividend yield vs peers (Seeking Alpha)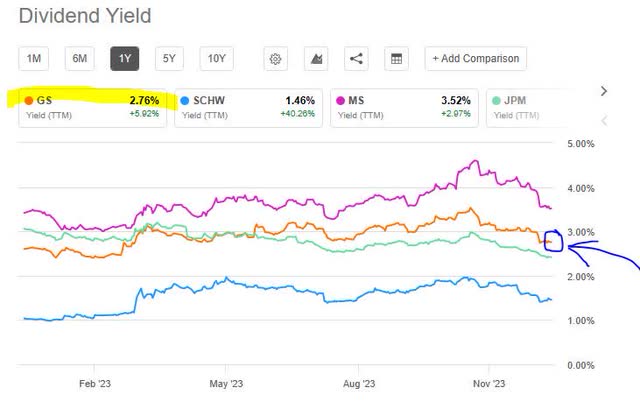
In this comparison, I am looking for the best yield on capital invested, if I had to pick one of these to add to a portfolio right now.
From the chart, we can see that Goldman has a trailing yield of 2.76% (2.89% forward yield), coming in 2nd in this group while Morgan Stanley led the pack with 3.52% yield.
Therefore, I would call it a hold in this category rather than a buy, on the basis that it has a nearly 3% yield which is not bad, but there are better options in this case I can get a better dividend return on Morgan Stanley stock, for the same amount of capital invested.
Revenue Growth
Here we get to look at the income statement and specifically the revenue YoY growth.
The good news is that revenue jumped to $11.81B in Q3 vs $11.46B in Sept 2022, a 3% YoY growth.
Drilling down into revenue segments, we can see that interest/dividend income grew on a YoY basis, but so did interest expense. In fact, it went from $8.55B in Sept 2022 to $18.25B in Q3, a 113% increase in interest expense.
This of course impacted net interest income, however revenue strength was shown in non-interest revenue such as growth in trading, asset management fees, and underwriting.
More importantly is looking forward to 2024, which I feel positive about since this is a major firm in the M&A/investment banking space and its CEO David Solomon in his Q3 comments indicated a positive sentiment in that regard:
I also expect a continued recovery in both capital markets and strategic activity if conditions remain conducive. As the leader in M&A advisory and equity underwriting, a resurgence in activity will undoubtedly be a tailwind for Goldman Sachs.
Also, relevant to mention is another segment, platform solutions, successfully grew revenue on a YoY basis:
GS – platform solutions revenue (company Q3 results)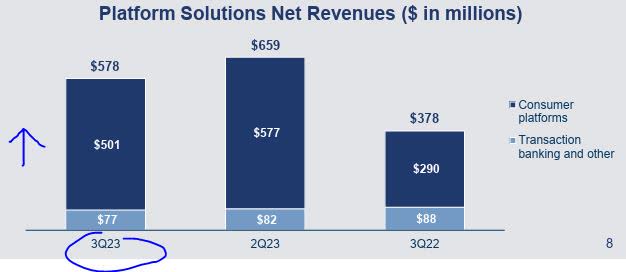
So, I would call this stock a buy in this category, on the basis of modest YoY revenue growth, growth in non-interest income and particularly success in M&A and platform solutions.
Earnings Growth
When it comes to earnings, it was a bit less rosy, according to the income statement.
YoY earnings fell to $2.05B, vs $3.06B in Sept 2022, a 33% YoY decline.
We can see a few different factors contributed to this headwind.
From its Q3 commentary we know that the asset and wealth management segment saw an impairment:
3Q23 operating expenses included impairments of $358 million related to consolidated real estate investments.
In the platform solutions segment, “3Q23 operating expenses included a write-down of intangibles of $506million related to GreenSky.”
The company also mentioned higher comp and benefits expenses in Q3, and higher transaction-based expenses.
In looking at the net income trend from March 2022 to now, it is not a steady upward or downward trend but rather lopsided, with net income see-sawing up and down each quarter. It is not a business also prone to certain seasonal factors like consumer retail stores being busier during holidays, for example, or airlines during peak travel seasons.
Though its earnings seesaw, it has remained profitable and not posted a net loss yet going back to March 2021.
I think therefore its profitability is sustainable, however my sentiment is to call it a sell in this category since it has yet to show me a decent YoY earnings growth.
Equity Positive Growth
The balance sheet shows that total equity fell somewhat to $117.74B in Q3 vs $120.11B in Sept 2022, a nearly 2% YoY decline.
This is nothing significant really to write home about, as they say.
Other capital-related points I want to mention is that the bank continues to have a CET1 ratio above +14%, well above regulatory minimums and Basel III standards.
It is also cash-rich, with its balance sheet showing +$239B in cash and equivalents.
Consider also that the Financial Stability Board listed Goldman in 2022 as one of several global systemically critical banks.
In this case, I think it is worthy of a hold rather than a buy or sell, on the basis of vast capital strength and systemic importance, offset by a slight equity decline which is not very significant for a firm like this.
Share Price vs Moving Average
In discussing the current share price vs 200-day simple moving average, consider the YChart below:
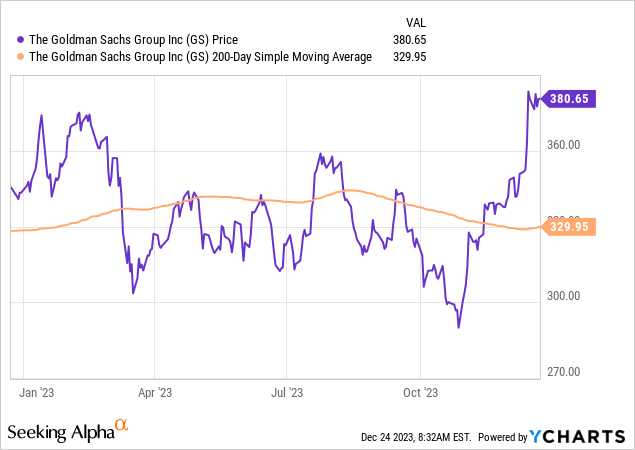
What we can see is very obvious, and that is a share price of $380.65 (as of Friday’s close) that is over +15% above the 200-day average.
We also have seen lots of bullishness in the financial sector lately after the most recent December meeting of the Fed.
Using Seeking Alpha’s market data page, we can see that financials are up +31% vs the last 3 years:
financial sector change (Seeking Alpha)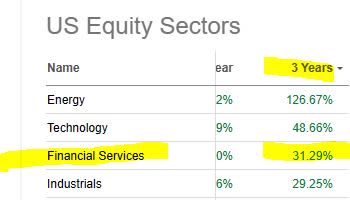
At the same time, Goldman’s own figures as mentioned already show weak revenue and earnings growth and slightly declining equity.
For these reasons, I would call it a sell at this price rather than a buy or hold, since the price has now exceeded even its January highs.
Valuation: Price-to-Earnings
From valuation metrics, we can see a GAAP-based forward P/E ratio of 16.39, which is +46% above the sector average of 11.19. This valuation got a grade of “D+” from Seeking Alpha.
In tying this multiple back to the share price and earnings results, I would say the driver of this is a combination of the spike in share price and the declining earnings, resulting in this elevated multiple of 16.4x earnings.
Lately, we saw bank stocks skyrocket a week or so ago after the most recent Fed meeting that indicated the possibility of rates coming down next year.
So, I think this share price is exceptionally high due to the market bullishness rather than the company’s own rising earnings, which have declined, and hence I would call it overvalued here and also give it a sell in this case.
Valuation: Price-to-Book Value
The forward P/B ratio is practically in line with the sector average of 1.21, so in this case the question is whether it is justifiable.
Tying back to the share price and book value data, we can see a huge spike in share price combined with a slight decline in equity. We also know that the company has a lot of equity to begin with, at almost $118B.
In this case I would call it a hold, on the basis that the valuation is in line with the average however at the same time the share price growth far exceeds equity growth since equity declined, creating a rift there I think. At the same time, a 1.2x book value is not such a high multiple to warrant a sell.
Risk Analysis
The key risk I would look at for a financial firm like this is exposure to commercial real estate (CRE). Here is what it looks like for Goldman:
GS – exposure to CRE (company q3 results)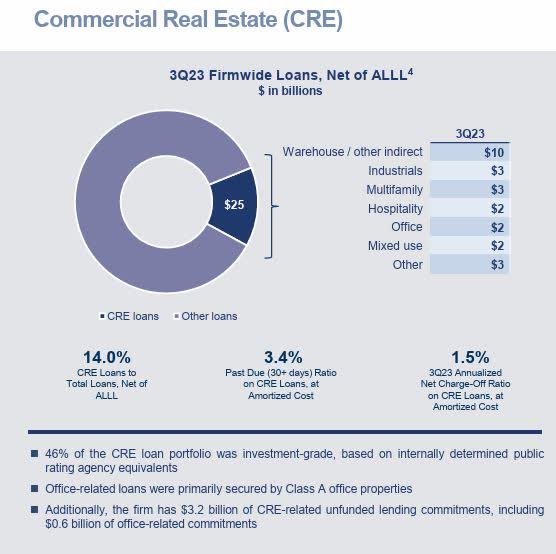
In this scenario, their commercial real estate book is just 14% of their overall loan book, so less than 1/4th. Of that CRE book, around $2B (or 8% of the book) is exposed to office property. Their biggest CRE exposure seems to be in warehouses.
Keep in mind that this firm is not engaged in consumer credit like a Capital One (COF) or a Bank of America (BAC) would be, but rather it is more known for being a banker for businesses and institutions, as well as top-tier investors / funds/ etc.
The risk of office defaults became front and center after several media reports this year called to attention a rising trend in defaults.
Silicon Valley is not immune either, as a news article this week mentioned:
A big San Jose tech building has toppled into default on its mortgage loan, a financial setback that underscores the widening economic ailments confronting the Bay Area office market in the wake of the coronavirus pandemic.
Fortunately for Goldman, the combination of its size/scale and its low exposure to offices in relation to its larger book, would make me give it a hold when it comes to this risk profile.
Quick Summary
To summarize, I am less bullish this time around on Goldman, calling it a hold, even though at first glance of the price chart it may have appeared to be a great sell opportunity.
Supporting my hold case is strong dividend income potential and proven growth, low risk exposure to office property in its CRE book, and capital/equity strength.
This is one of those systemic banks I would want to hold on to in a financials portfolio. I am also expected a jump in M&A and investment banking activity as equity markets improve going into 2024, driving more confidence for deals while debt financing costs stabilizes as rates start to stabilize and come down sometime in 2024, perhaps.
Credit: Source link