

Daniel Wright/iStock Editorial via Getty Images
Investment Thesis
It cannot be emphasized enough: Global Ship Lease (NYSE:GSL) seems undervalued even under the direst of assumptions. And this seems true for virtually every valuation method out there, whether it’s discounted cash flow (DCF), comparable companies (comps), or any of the various financial ratios. But the problem is that the price is not just near its 52-week high but near the highest since 2015! So, it seems improbable that the stock price will appreciate a lot more than it has already. Still, my DCF model under unusually pessimistic assumptions points to an intrinsic value of no less than $42, while my comps’ analysis shows no less than $30 and possibly as high as $90+ in intrinsic value! Moreover, escalating shipping rates, charter rates, and maritime stresses are all positive for GSL.
Furthermore, GSL has bested EPS expectations in 18 of the last 20 quarters. Plus, the stock has a generous dividend yield of over 5%, so even if the price doesn’t rise, it still will provide a nice dividend. Overall, I rate GSL a “Moderate Buy.” The only major knock is the fact that the stock is already near recent highs, which, to be fair, is a major issue, and should dissuade any sort of large investment in the stock at this time. However, it remains objectively undervalued, stands to benefit from recent trends, and has a solid dividend.
Company Overview
Global Ship Lease is a containership owner leasing ships to container shipping companies under fixed-rate time charters with industry-standard terms. The Marshall Islands corporation has its administrative office in Athens, Greece. It owns 68 mid-sized and smaller containerships.
Qualitative Insights
What you may not see from the numbers below is that GSL’s business model is somewhat one-of-a-kind in that it is meant to do well both in economic expansion and contraction. When the economy is booming, shipping companies expand capacity with chartered tonnage. When the economy is declining, they opt for sale and charter-back arrangements to free up capital. Therefore, GSL stands to benefit from market growth because it provides shipping companies with additional capacity and from market contractions by offering them financial relief through charter-back options. What’s more, GSL depends on fixed-rate time charters, so it gets steady revenue irrespective of spot market volatility.
Moreover, their chief focus on mid-sized and smaller containerships really works out in GSL’s favor. In fact, approximately 70% of containerized trade volumes are Non-Mainlane and intra-regional trades, which allows them to cash in the lion’s share of the market while staying out of the heavy competition on the main lanes. It also distinctly positions them to be able to fulfill the demand for shipping in developing markets that many of their major-lane-focused competitors cannot.
Another one of GSL’s major selling points is their unusually flexible chartering options. These include varying contract lengths and a wide variety of different payment and service methods tailored specifically to each customer’s needs. By the end of March 31, 2024, GSL had contracted revenues totaling $1.6 billion with an average contract length of 1.9 years.
And finally, GSL’s strategy is designed to emphasize strategic, value-adding expansion and acquisitions. A case in point is the big move the company did in Q4 2018 when it doubled the size of its fleet. The company balanced long-term contracts with short-term deals by acquiring a large number of ships while making sure to secure both long-term and short-term charters. This allows the company to lock in a stable long-term revenue while remaining flexible enough to take advantage of short-term market opportunities.
GSL’s general business strategy and sources of competitive advantage can be characterized as follows: fixed-rate charters that provide revenue stability; specialization in niche markets where competition is avoided, but still a large portion of the market potential is tapped; revenue sources both during economic upturns and during downturns; unusually flexible chartering options; and shrewd moves in expansion and acquisition. I think it is a very solid business strategy that bestows upon them an immense competitive advantage, and therefore investment in the business is a wise move.
Financials
The company’s financials are strong and reflect the growth it has been experiencing year by year. Revenue, EBITDA, and EBIT have all increased since 2018. Revenues have grown from $157.097 million in 2018 to $674.795 million in 2023, EBITDA has grown from $29.726 million in 2018 to $436.662 million in 2023, and EBIT has grown from -$10.26 million in 2018 to $343.218 million in 2023. The free cash flow (FCF) for the company was around -$245.046M in the year 2021, but this was only on an isolated basis, as capital expenditure remained quite high in that year alone. Apart from this, free cash flows of GSL have been robust over the last few years, having been realized at $39.259M, $77.4491M, $139.867M, $408.196M, and $318.468M in the years of 2018, 2019, 2020, 2022, and 2023 respectively. In addition to this, the company’s EPS has topped consensus estimates in eighteen of the previous twenty quarters, according to Seeking Alpha.
Seeking Alpha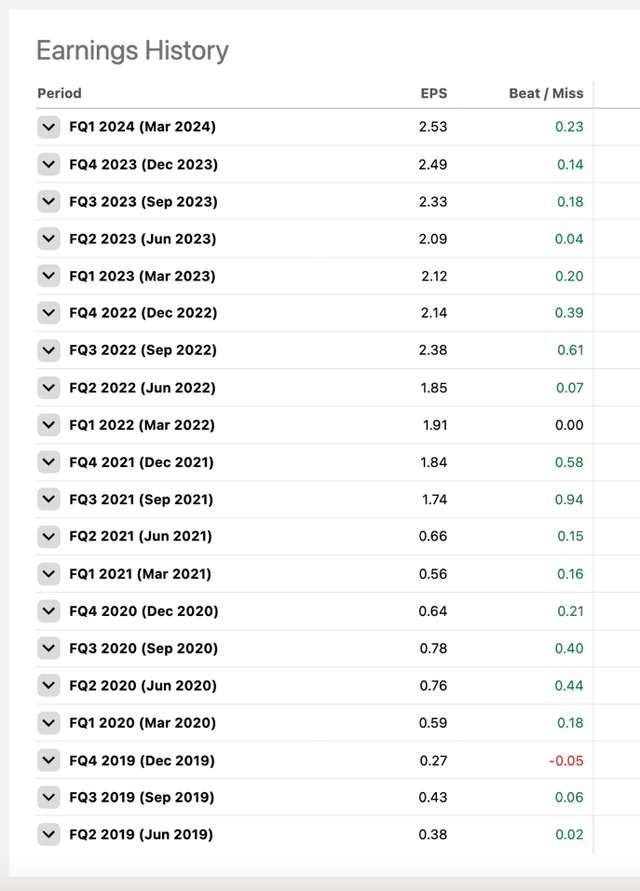
Valuation
In my prior articles, I forecasted free cash flows for my DCF models using historical data on free cash flow and linear regression. For my first GSL DCF model, I used the same general methodology but with historical EBIT, D&A, Capex, and Change in NWC data and linear regression to project the data into the future over the next five years. I then determined the free cash flows as: EBIT – Taxes + D&A – Capex – Change in NWC. It is important to note that this is how most DCF models are built. Most DCF models do not directly forecast free cash flow; instead, they forecast EBIT, Taxes, D&A, Capex, and Change in NWC and use the forecast of these components to calculate each future year’s free cash flow.
Anyway, over the years, GSL has paid almost no income taxes – with its largest tax expense ever equal to just 0.13% of EBIT – $448,000 – in 2023. Income taxes equal to just 0.13% of EBIT may sound minuscule, but that’s nothing compared to many earlier years’ even lower rates, such as, -0.01412% of EBIT in 2022, 0.02358% of EBIT in 2021, 0.04677% of EBIT in 2020, and 0.00269% of EBIT in 2019. Nevertheless, I took an extremely pessimistic approach and assumed that income taxes will equal 25% of EBIT every year for the next five years – a level the company has never even come close to seeing.
So keep in mind, some of the assumptions for this DCF model are not merely “pessimistic” but are downright impossible. That being said, the model still calculated an intrinsic value of $73.17, indicating a good amount of upside at +$47.11 or +180.78% from today’s $26.06. Further, it should be noted that DCF models generally compute terminal value in the following way: last free cash flow projection multiplied by one plus perpetual growth rate divided by the difference between WACC and perpetual growth rate. However, I did not use the last forecast of FCF in calculating the terminal value, as this was the highest of the series; instead, I calculated it using the average of the five FCF projections, and my analysis still shows GSL is severely undervalued.
Author’s Calculations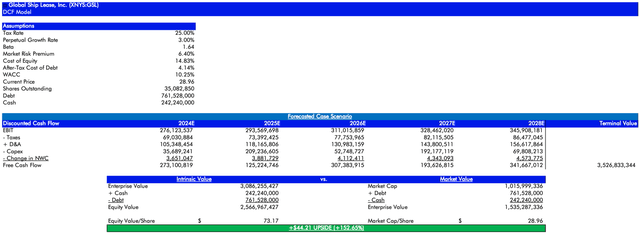
Please note that I crafted the above model on July 2nd when the price was $28.96. The price now is $26.06, so the upside potential is even greater.
I have also done a sensitivity analysis for different WACCs and perpetual growth rates. In the analysis, I varied the perpetual growth rates from 1% to 5%. For the WACC, I took the lower bound to be the lowest WACC estimate for GSL I could find online at 6.60% and the upper bound to be the GSL cost of equity at 14.83%. The range was then divided into five equal segments: 6.60%, 8.66%, 10.71%, 12.77%, and 14.83%. The results were astonishing. All the cases, from the perpetual growth rates of 1% to 5% and WACCs of 6.6% to 14.83%, all projected upside compared to the price when I built the model of $28.96, ranging from an upside of $5.45 with 14.83% WACC and 1% perpetual growth rate to an upside of $322.54 with 6.6% WACC and 5% perpetual growth rate.
Author’s Calculations
But the day after I constructed the DCF above, I decided to mix things up a bit. My first model used linear regression for forecasting. I decided to experiment with several other forecasting approaches, including Holt-Winters Exponential Smoothing, ARIMA (AutoRegressive Integrated Moving Average), SARIMA (Seasonal ARIMA), Random Forest Regression, and Prophet. Of these, I believe Prophet gave me the most realistic forecasts. Prophet is a forecasting tool, developed by Facebook’s data scientists for Python and R, that is known for capturing variability, seasonality, holidays, and trend shifts much better than other models. This tool is particularly suited for the forecasting of GSL’s financials because its historical financial patterns are complex (i.e. they don’t follow a simple, consistent increasing or decreasing trend) and are likely to remain so, a complexity that Prophet is adept at capturing. For my new DCF model, I used the Prophet module in R and GSL’s historic data to forecast its EBIT, D&A, Capex, and Change in NWC for each of the next 5 years, assumed a constant effective tax rate equal to GSL’s highest effective tax rate in its history of 0.13% of its EBIT, and used these forecasts to calculate the free cash flows. My R code for these calculations can be found here. As in my original model, I didn’t use the last FCF projection for the terminal value calculation, but the average of the five FCF forecasts instead. The model indicated an intrinsic value of $42.00 and therefore a potential upside of $15.94 (+61.17%) from the current price of $26.06.
My improved GSL DCF model using Facebook’s Prophet algorithm to forecast EBIT, D&A, Capex, and Change in NWC. (Author’s Calculations)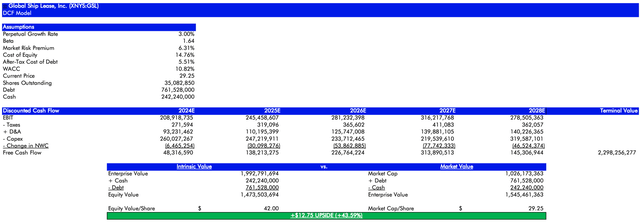
Note that the above model was made on July 3rd when the price was $29.25. The current price of the stock is at $26.06. Hence, the upside potential is even greater.
I think this DCF model is basically spot on and pretty much represents my “official” forecast for the company, though perhaps I’d switch the 2024 and 2027 projections since the ongoing Red Sea crisis should be a tremendous boon to GSL and hence 2024 should be among its best years; however, I just inputted the algorithm’s forecasts verbatim in the model above, and an algorithm can’t account for such specifics, and switching these years would make virtually no difference in the overall intrinsic value calculation anyway. Just ignore the other DCF model; it was shown just to show how much better more advanced forecasting algorithms are compared to simple linear regression. From now on, I will apply algorithms like Prophet or Random Forest Regression in most of my DCF models. Nevertheless, while linear regression may have not been as realistic as Prophet’s forecasts, it still performed well in realistically estimating the future cash flows, and unlike the new model, the initial model included a tax expense assumption which was so pessimistic that it was practically impossible and still showed enormous upside.
And another thing you should keep in mind is the WACC I used for GSL is far higher than all others I could find online. I calculated a WACC of 10.82%, while GuruFocus calculated a WACC of 7.75%, AlphaSpread calculated a WACC of 8.5% and Valueinvesting.io gave a WACC range of 6.6%-8.5%. The results of the sensitivity analysis for my new model are not as good as those of the sensitivity analysis for the initial model, but they’re also not unimpressive. WACCs from 6.6% to 10.68% indicate upside compared to the price of $29.25 for all perpetual growth rates from 1% to 5%, and even a WACC as high as 12.72% indicates upside for perpetual growth rates greater than 2%. Even with the highly unlikely, absolute worst-case scenario WACC of 14.76%, the pitfalls are still less than expected. To summarize, even if DCF models are highly sensitive to assumptions, my sensitivity analysis suggests that GSL is undervalued in most conceivable circumstances.
Author’s Calculations
Moreover, the financial ratios of GSL are great. Its P/E ratio stands at 3.19 compared to the Industrials industry median of 22.96, its EV/EBITDA ratio stands at 3.34 compared to the Industrials industry median of 12.61, and its Price-to-Book (P/B) ratio stands at 0.82 compared to the Industrials industry median of 2.74.
I conducted comps analysis for GSL using PANL, SB, CPLP, NMM, and CMRE as its peers. I decided to use three metrics: EV/EBITDA, P/E, and P/B. Using the average EV/EBITDA ratio of GSL and its peers, the intrinsic value of GSL is $77.03, showing an upside of 195.59% compared to the current price of $26.06. The median EV/EBITDA ratio predicts that GSL has an intrinsic value of $93.41, an upside of 258.44%. With the average P/E ratio, GSL’s intrinsic value is $62.02, depicting an upside of 137.99%; with the median P/E ratio, it is $59.46, showing an upside of 128.17%. With the average P/B ratio, GSL’s intrinsic value comes out to be $29.26, an upside of 12.28%. Finally, the median P/B ratio gives GSL an intrinsic value of $29.41, an upside of 12.85%.
Author’s Calculations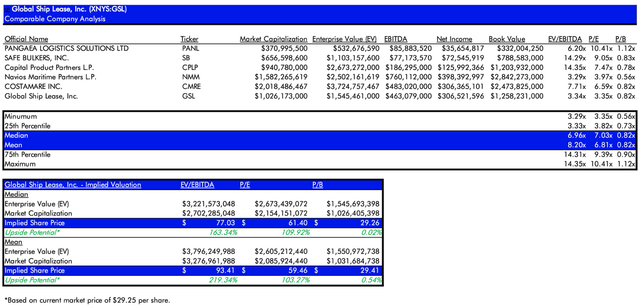
(Sources: Refinitiv, Yahoo Finance)
Please note, I constructed the model above on July 3rd when the price was $29.25. The price is $26.06, so the possible upsides are even bigger.
By all valuations, it is quite clear that GSL is at least moderately undervalued, if not considerably more. That view is not unique to my models; it is a common one amongst many analysts who regard GSL’s valuations as its most attractive feature, as evidenced by an A+ rating for Valuation from Seeking Alpha. Valuations, of course, do not tell the whole story. There are many examples of stocks that have been poor performers, even though they were universally regarded as ‘undervalued’ by any measure of valuations. Therefore, one should consider other factors, such as qualitative ones, before making any final investment decisions.
Seeking Alpha’s factor grades for GSL. (Seeking Alpha)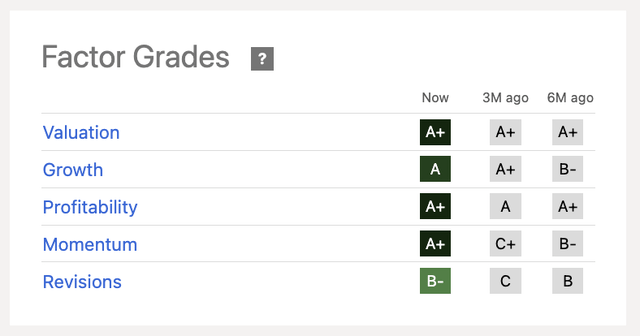
Trends
I think GSL should benefit immensely from several recent trends. First of all, shipping rates are widely expected to rise. Transportation Insights projects a 30%-40% growth, ACT Research expects around 20%, and FTR forecasts just over 10%. GSL should also benefit from worldwide container shortages that will increase demand, charter rates, and asset values. Maritime stresses are also good for GSL because they lead to diversions, re-routing, and extra miles at sea, which increase demand and revenues. For example, the ongoing Red Sea crisis has led to a sharp increase in charter rates, with June 2024 rates up by 113% compared to the end of 2013. However, this also means that there might be potential for decline once these stresses are relieved, which takes me to the next part…
Risks
While the ship rerouting through the Cape of Good Hope has been absolutely fantastic for GSL, it may not be so good for the company if ships can revert to their usual Red Sea and Suez Canal routes. BIMCO forecasts 14.5%-15.5% growth in ship demand in 2024 but a decline of 4.5%-5.5% in 2025, assuming that the Red Sea and the Suez Canal become accessible again.
BIMCO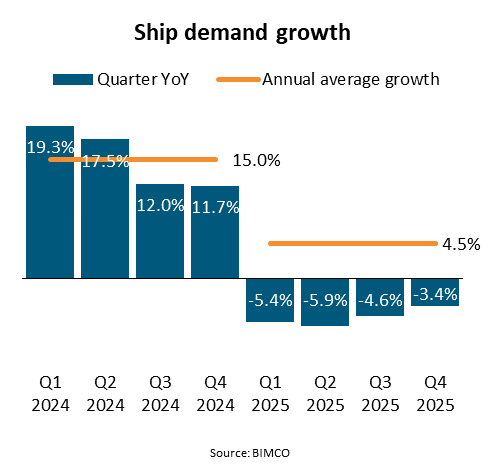
This is a small concern of mine because even if revenues do moderately decrease come 2025, the company is still undervalued. My biggest worry is the fact that GSL is at its highs already, or near it in this case. This makes it seem unlikely that the stock price will appreciate significantly more than it already has. The last time the stock price was around $30 was back in March 2022; afterward, it made a steep drop and has just recently returned to around $30. This could be a repeat of March 2022, in which case $30 might represent the high point for this stock. While I believe GSL should be worth at least $35 based on fundamentals, markets aren’t always rational, and this could be a “value trap” that never meets its true intrinsic value. Recently, the price has declined from $29.25 to $26.06, perhaps making it a bit more attractive. Nevertheless, the fact that it’s already near its highest levels since 2015 alone should prevent any significant investment in the stock at the moment, no matter how fundamentally undervalued the company appears to be.
Conclusion
On balance, I would rate GSL a “Moderate Buy.” At $26.06, the company seems undervalued, and perhaps a modest investment in the stock would be a smart move at the moment. However, I fear that this might be a classic example of a “value trap” that will never reach its intrinsic value, which I think should be something in the region of $40. So, if you do buy GSL shares, I may just recommend selling them once the price comes in between $31-$33. Still a pretty good ROI from $27.90, right? I’m not expecting the stock to skyrocket; it’s more like it should do well, and if it doesn’t, at least there is a nice 5%+ dividend.
Credit: Source link