
claffra
As we head into what promises to be a wildly volatile year on the political scene, it’s time to examine one of the key factors influencing the direction of both the U.S. economy and the financial market, namely energy prices. Oil and gasoline prices can be viewed as barometers of consumer strength or weakness, thus providing clues for investors as to the likelihood of recession. And while a recession doesn’t appear to be in the cards for 2024, there are nonetheless signs that the average consumer is still feeling the pinch from inflation, as we’ll discuss here.
For a good part of the last four years, consumers have been beset with runaway increase in retail gasoline prices. As one commentator put it years ago, a high gas price is most discouraging for U.S. consumers, for if anything represents the American way of life, it is the freedom of the automobile on the open road. That statement highlights the toll that higher unleaded gas prices have on U.S. consumers’ confidence and, more importantly, on consumer spending (which accounts for nearly 70% of national GDP).
Higher fuel prices naturally mean higher costs for a vast array of consumer goods—food in particular—due to associated delivery costs. And with reduced oil drilling in the U.S. (see chart below), coupled with foreign wars that impact the world market, serving as headwinds against the petroleum market in recent years, it has been difficult for gas prices to appreciably decline and thereby give consumers a break.
U.S. EIA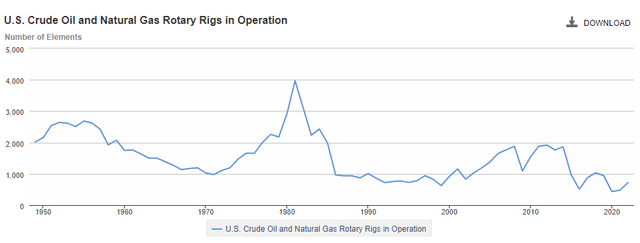
However, rising demand is also a factor in the fuel price runup of recent years. Indeed, petroleum market analysts have pointed out that increasing fuel demand following Covid-era shutdowns and disruptions has been a big reason for rising oil/gas prices. In view of the strong economic rebound following 2020, there can be little doubt that this assertion is true.
If we accept both propositions as being true, what accounts then for the recent sharp drop in gasoline prices at the pump? Since peaking at a multi-decade high around $5/gallon in 2022, the nationwide retail gas price average has fallen 40% and now sits just above $3.
GasBuddy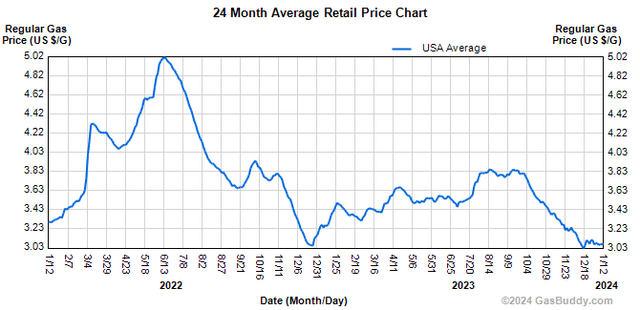
Is this the result of a recent surge in gas stocks (up 8% from a year ago, according to the U.S. EIA)? Or is the sharp gas price drop the result of slumping demand on the part of increasingly tapped out consumers? (The latter is likely the case, as we’ll see here.)
Declining fuel prices could be a boon to consumer spending in the coming months if it’s in fact the result of higher supplies. But if falling demand is the culprit, then a slowing economy will be the likely result, with a potential negative impact on equity prices at some point down the line.
Indeed, petroleum industry and travel analysts are increasingly blaming lower demand from consumers as one of the reasons for the pump price drop. An American Automobile Association spokesperson was recently quoted by USA Today pegged “lower demand from drivers” as a key reason for falling gas prices in California.
What’s more, at least one consumer survey suggests that the average American expects retail prices to increase nearly 5% this year, which lends credence to consumers cutting back on travel expenses—in turn leading to falling consumer sentiment levels over the last several months.
The Felder Report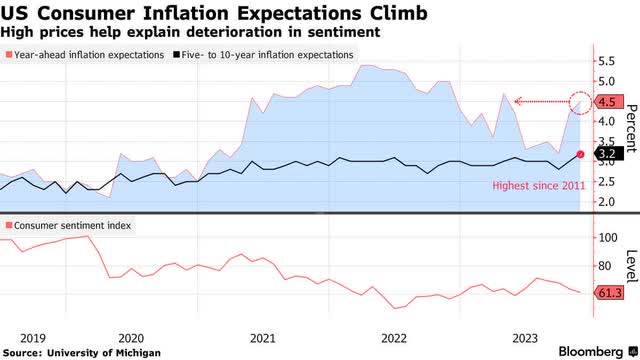
Moreover, a November U.S. News & World Report article informs us that while Americans “are still not completely tapped out,” credit card spending recently hit a record.
Even more worrying, credit card delinquencies are also on the rise according to the Federal Reserve. The above article quoted a Fed analyst, who noted: “The continued rise in credit card delinquency rates is broad based across income and regions, but particularly pronounced among millennials and those with auto loans and student loans.” On that score, the Wall Street Journal recently observed that “the frequency with which people are becoming late with payments on their debts for some kinds of loans is returning not just to pre-pandemic levels, but even moving beyond them.”
St. Louis Fed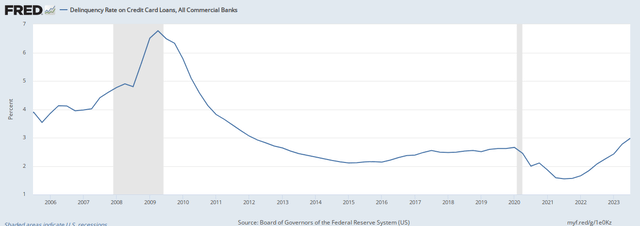
These observations have prompted many analysts to speculate that excess consumer borrowing is indeed becoming a major problem moving forward—and one that could contribute to a recession in 2024.
At this point allow me to interject that I don’t expect a recession this year. However, I do believe consumers are under considerable stress as it pertains to high food and shelter costs. The runup of credit card balances, coupled with diminishing gasoline demand, therefore shouldn’t be lightly dismissed by the economic optimists.
Let’s now take a look at the cash market chart for the Reformulated Blendstock for Oxygenate Blending (RBOB) gasoline (which is used to create the gasoline sold at the pump when blended with ethanol). Here you can see much the same pattern as in the 2-year chart for gasoline shown above, only this one stretches back to January 2019. The early 2022 price peak is also visible, as is the parallel drop to nearly two-year lows. For the RBOB chart, the current price has settled just above $2/gallon.
Barchart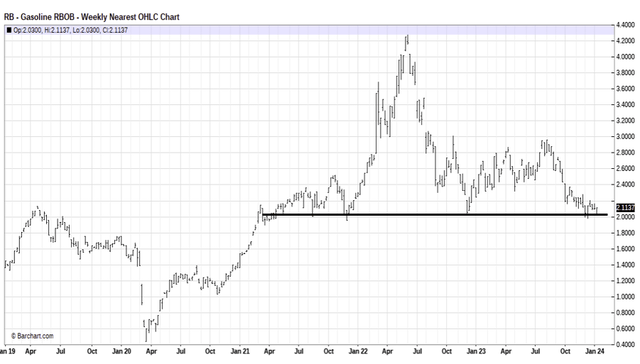
It happens that the $2 area is a potential key price point for RBOB since it corresponds to the “neckline” of a classic head-and-shoulders (H&S) price pattern. I’m not a purist when it comes to classic chart patterns, and truth be told, the H&S pattern is one of the most notoriously unreliable of all patterns. That said, I would view a decisive drop under the $2 level (and under $3 in the above retail gasoline chart) as a legitimate “heads-up” (pun intended) sign that serious trouble is afoot in the consumer economy as this would almost certainly further trigger technical selling. This in turn would have serious implications for equity investors and would likely result in a significant increase in overall stock price volatility, as turmoil in the petroleum market would likely cause investors to question the economy’s strength.
As for the near-term impact on the stock market of rising consumer debt and falling fuel prices, let’s consider what’s happening under the market’s proverbial hood right now. On the NYSE, the new 52-week highs have signs of diminishing in the last couple of weeks while new lows slowly increased. The result is that in the week ended January 12, the new high/low ratio fell to a meager 2-to 1 ratio. That’s less than the (minimum) 3-to-1 ratio that characterizes a normal, healthy market environment.
However, at no time in recent weeks have new 52-week lows exceeded 40 per day on the Big Board. Forty new lows is the number that historically divides a healthy from an unhealthy market environment. In fact, on most days of the last few months there have been around just 20-something new lows on average. That’s not bad at all and suggests there’s currently no internal selling pressure to speak of within the broad NYSE market.
That said, if fuel prices continue declining it will demand a closer scrutiny by participants since it would almost certainly signify a further reduction of consumer demand. For now, though, the major sectors of the stock market aren’t suffering any discernible internal weakness and therefore shouldn’t be a concern for investors.
Credit: Source link