

malerapaso
Continuing my series of updates on dividend-focused investment vehicles, today I would like to present a fresh take on the First Trust Value Line® Dividend Index Fund ETF (NYSEARCA:FVD), which I previously dissected in May 2022, with a Hold rating. Even though it has been a while since the previous coverage and the market context has changed significantly, I see no reason for an upgrade. FVD might have a brilliant idea at its crux, but neither the performance it delivered in the past nor the factor mix its portfolio is offering can justify a Buy rating at this point. Let us review all that in greater depth below in the note.
Investment strategy
According to the fund’s website, the foundation of its strategy is the Value Line® Dividend Index. The starting point is the pool of stocks that earned a SafetyTM Ranking of #1 or #2 in the proprietary system of Value Line®. The summary prospectus has the following description of the factors used:
According to information published by Value Line, the Safety Rank is derived from two equally weighted measurements, a security’s “price stability rank” and “financial strength rating.” A security’s “price stability rank” is based on the standard deviation of weekly percent changes in the price of the security over the last five years. A company’s “financial strength rating” is the Index Provider’s measure of a company’s financial condition.
RICs, LPs, and “foreign securities not listed in the U.S.” are shown the red light. The next step is to pick higher-yielding names, which means those “with a lower than average dividend yield, as compared to the indicated dividend yield of the S&P 500 Index” must be removed. After that, companies with a market cap below $1 billion are excluded, and those remaining are weighted equally. The index is rebalanced and reconstituted monthly.
Factor mix: healthy but not perfect
As of January 16, FVD had 162 holdings, with utilities being its major allocation, accounting for 20.5% of the net assets. In the May 2022 note, I mentioned that
…FVD’s tilt towards this sector deemed defensive is something permanent, though the exact allocation has been fluctuating over time.
And it seems this point remains valid. Importantly, FVD’s large exposure to utilities has two major implications. First, the sector bolstered its weighted-average earnings yield, which was at around 5.1% as of January 17, as my calculations show. To corroborate, 28 out of 34 utilities in its portfolio have an EY of at least 5%, with the top result being Public Service Enterprise Group’s (PEG) 9.5%. Second, there are no utilities sector stocks with a 24-month or 60-month beta coefficient of 1; the median figures for the sector are 0.55 and 0.54, respectively. And this is one of the reasons why FVD’s WA coefficients are at 0.69 and 0.72, which should definitely appeal to volatility-averse investors.
Overall, I would say that the portfolio’s factor mix is healthy but still fairly far from perfect. Of course, we see a meaningful tilt toward the quality factor, which is indicated by a large share of holdings with an at least B- Quant Profitability rating or higher (close to 85%), Return on Equity, Return on Assets, and a fairly robust weighted-average net income margin, mostly supported by Emerson Electric (EMR) and CME Group (CME).
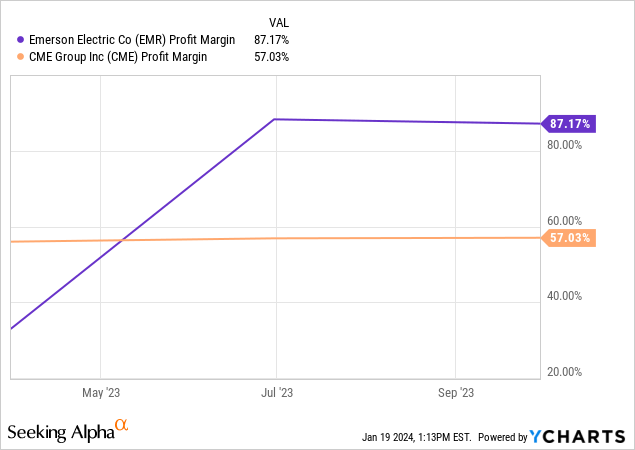
However, for a predominantly large-cap mix (though about a fifth of the net assets are allocated to small- and mid-cap names), this is adequate but not spectacular. I would prefer an over 90% allocation to highly profitable names (a B- rating or better), an at least 20% net income margin, and about 10% ROA.
| Metric | Holdings as of January 16 |
| Market Cap | $79.398 billion |
| EY | 5.12% |
| P/S | 3.04 |
| EPS Fwd | 8.22% |
| Revenue Fwd | 4.92% |
| ROE | 50.86% |
| ROA | 7.31% |
| NI Margin | 14.37% |
| Quant Valuation B- or better | 16.39% |
| Quant Valuation D+ or worse | 56.25% |
| Quant Profitability B- or better | 84.92% |
| Quant Profitability D+ or worse | 5.28% |
Calculated using data from Seeking Alpha and the fund. Financial data as of January 17
Regarding the growth factor, around 12.3% of the holdings will have to tackle revenue contraction going forward, as illustrated by pundits’ estimates, which in the case of 14 companies will likely put pressure on margins and result in earnings decline as well, with the main example being Pfizer (PFE). As a consequence, we see a mid-single-digit WA revenue growth rate, which I believe is too weak for 2024. Portfolio-wise EPS growth looks stronger, yet the issue here is that it is solidly influenced by AstraZeneca’s (AZN) 320% rate, while most holdings (122, to be precise) have sub-10% rates.
On the dividend front, we see a DY of 2.37%, which is 1.65x stronger than the yield of the iShares Core S&P 500 ETF (IVV). The weighted-average yield of the portfolio is a bit higher at 2.83%. But there is nothing special about dividend growth, as both 3-year and 5-year CAGRs for the basket are only in single digits.
| DY | Div Growth 3Y | Div Growth 5Y |
| 2.83% | 8% | 7.69% |
Calculated by the author using data from Seeking Alpha and the fund
Regarding value, while the EY is comparatively attractive, I would not say FVD offers much here as companies with a B- Valuation rating or higher account for just 16.4% of the portfolio; a 3x P/S ratio is also on the expensive side.
Performance
FVD has a nuanced track record. Obviously, it might be considered a nice allocation to prepare for a recession or/and a bear market. Yet as a long-term holding, especially with its heavy fees factored in, it is a poor, under-delivering option. More specifically, as I have already mentioned in the September 2021 coverage, FVD was much better prepared for the Great Recession than IVV. For example, in 2008, it was down by about 23% while the S&P 500 ETF cratered by around 37%. However, the context is that FVD underperformed IVV by 7.4% in 2009; in 2010–2022, it underperformed IVV eight times, with the 2019–2021 period being especially lackluster.
| Year | % underperformance vs. IVV |
| 2019 | -4.68% |
| 2020 | -18.47% |
| 2021 | -3.70% |
Calculated using data from Portfolio Visualizer
Truly, it weathered the 2022 bear market much easier than the S&P 500 ETF, outperforming it by almost 13%. The problem, precisely like in the case of most low-beta portfolios, is its inability to catch up with the market during the recovery phase: in 2023, it was 22.2% behind IVV. And since my May 2022 note, it has been completely unable to keep pace with the S&P 500.
Seeking Alpha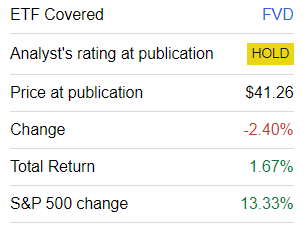
Next, compared to a few dividend funds I cover, including the FlexShares Quality Dividend Defensive Index Fund ETF (QDEF), which targets low-beta companies, FVD demonstrated the weakest annualized return over the ten-year period.
| Portfolio | FVD | Schwab U.S. Dividend Equity ETF™ (SCHD) | ProShares S&P 500 Dividend Aristocrats (NOBL) | WisdomTree U.S. Total Dividend ETF (DTD) | QDEF | IVV |
| Initial Balance | $10,000 | $10,000 | $10,000 | $10,000 | $10,000 | $10,000 |
| Final Balance | $23,838 | $28,479 | $26,278 | $25,343 | $24,866 | $31,045 |
| CAGR | 9.08% | 11.03% | 10.14% | 9.75% | 9.54% | 12.00% |
| Stdev | 13.04% | 14.65% | 14.62% | 14.51% | 14.03% | 15.18% |
| Best Year | 26.57% | 29.87% | 26.94% | 28.19% | 25.46% | 31.25% |
| Worst Year | -5.20% | -5.56% | -6.51% | -6.44% | -10.94% | -18.16% |
| Max. Drawdown | -22.65% | -21.54% | -23.23% | -25.27% | -23.22% | -23.93% |
| Sharpe Ratio | 0.64 | 0.7 | 0.65 | 0.63 | 0.63 | 0.74 |
| Sortino Ratio | 0.95 | 1.14 | 1.01 | 0.95 | 0.95 | 1.16 |
| Market Correlation | 0.9 | 0.91 | 0.93 | 0.95 | 0.96 | 1 |
The period covered is January 2014–December 2023. Data from Portfolio Visualizer
Conclusion
In sum, FVD is designed for dividend investors who are not ready for compromises when it comes to the resilience of financial position and volatility. However, it has a burdensome 65 bps expense ratio and an unideal past performance. Even though it does offer a defensive tilt, as illustrated by the weighted-average beta coefficients and its performance during the Great Recession in 2008 and the 2022 bear market, it still significantly under-delivered over the last ten years, as it was unable to keep pace either with the S&P 500 or with a few dividend-oriented peers. All in all, a Buy rating would be unjustified.
Credit: Source link