ArtistGNDphotography/E+ via Getty Images
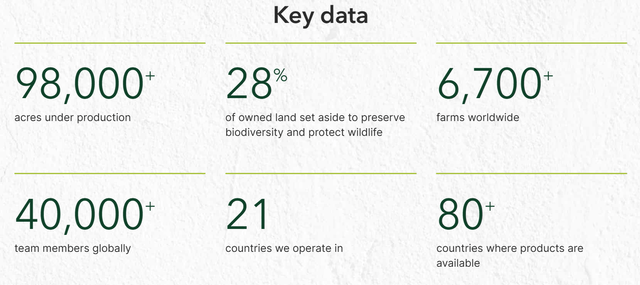
Fresh Del Monte Produce Inc. (NYSE:FDP) is a global grower and supplier of bananas, alongside a list of other fresh fruits and vegetables, cleaned and sometimes packaged for consumers to buy at your local grocery store. (Not to be confused with Del Monte Pacific Limited, a different company canning vegetables like green beans.)
I last wrote about the incredible FDP value proposition developing in its stock back in November here. After a quick +30% share price gain after that article was published, price has slowly eroded, and is now trading at roughly the same level as seven months ago. The good news is profits and cash flow keep coming in the door daily, increasing the company’s underlying worth. The dividend has been raised to $1.00 annually (which works out to 4.7% on a forward-yield basis), and free cash flow yield is now running at 11.7%.
Even better news is today’s $21.50 share quote is trading at approximately HALF (50% discount) of the asset liquidation value estimate of $40 outlined in my first story. Additionally, for the first time since public trading began late 1997, the enterprise value (including both debt and equity market-trading totals) of the business has fallen below its cost-accounting and depreciated tangible book value.
The whole investment setup is screaming to be bought, if you can remove your focus from the AI craze and search for a real bargain in the stock market. Honestly, in terms of finding a terrific food inflation hedge idea for your portfolio, with both deep value and high dividend yield, Fresh Del Monte stands out as perhaps “the” top pick for safety-minded, long-term investors.
It’s even possible FDP will rise in price over the next 12-18 months, swimming against the stream of an approaching Big Tech correction and major bear market on Wall Street over the next year or two. That’s why I have made Fresh Del Monte one of my largest brokerage account positions for any individual company. Let me explain my Strong Buy rating in more detail.
Fresh Del Monte Produce Website – June 19tth, 2024 Fresh Del Monte Produce Website – June 19tth, 2024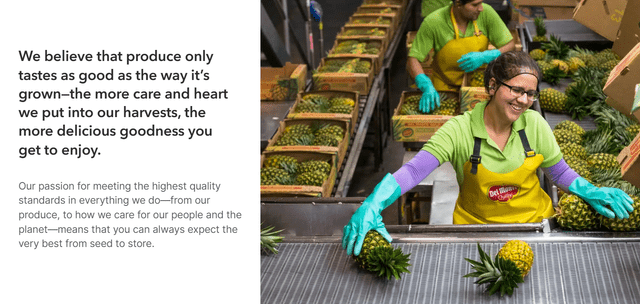
Bullish Valuation Setup
The highlight datapoint to consider for purchase is the company’s total value is quite low compared to net assets owned. You get things like cash, inventory, accounts receivable, warehouses, ocean vessels, equipment, and tens of thousands of acres of land to grow food (the majority of acreage is located in Central and South America), in one fully integrated business design retaining $2.75 billion in depreciated-hard asset worth on its accounting books (at the end of March). This is matched against $400 million in financial debt, and $1.27 billion in total liabilities. My view is the remaining $1.48 billion in tangible book value is absolutely understating the inflated fair-market liquidation value of things including plant/equipment and farm/orchid holdings.
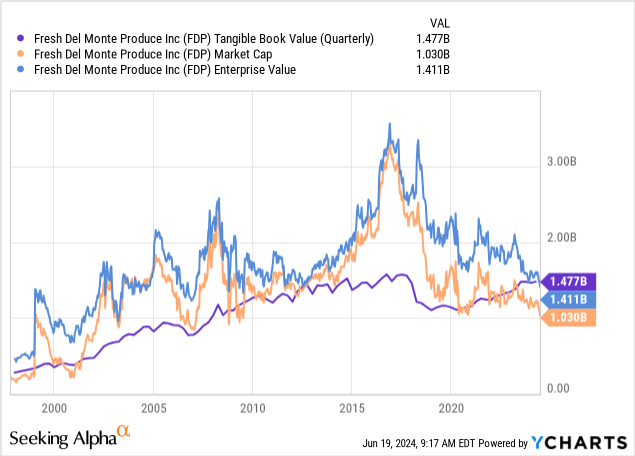
The amazing and rare part of the valuation equation is the current net “enterprise value” of $1.41 billion (total equity capitalization plus debt minus cash holdings) is LOWER than traditional cost-accounting measured tangible book value. This ultra-cheap valuation on net assets is almost entirely reserved for companies generating large income losses annually, not strong operating income like FDP.
Below are two charts, 10-year and 26-year versions, to visually explain this bullish comparison exercise for Fresh Del Monte in June 2024. My summary is the share price has been discounted to book value on occasion, but never has the net company value including debt been this inexpensive to own before today.
YCharts – Fresh Del Monte Produce, Tangible BV to Equity Market Cap & Total Enterprise Value, 10 Years YCharts – Fresh Del Monte Produce, Tangible BV to Equity Market Cap & Total Enterprise Value, Since 1998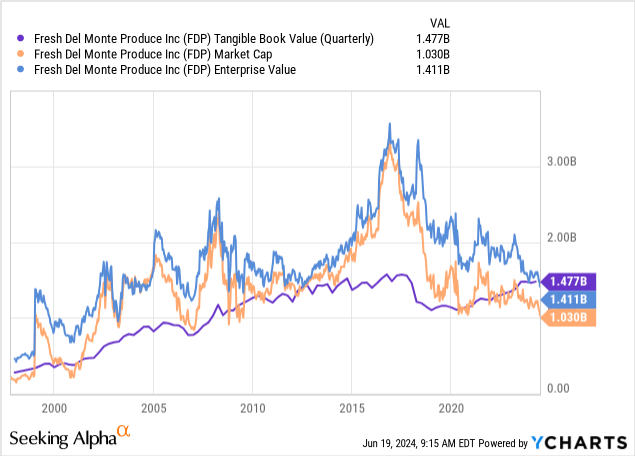
Other fundamental valuation ratios on operations are equally screaming buy to me. Price to trailing cash flow multiples of 5.7x have only been cheaper about 10% of the time since the Great Recession in 2008-09.
YCharts – Price to Trailing Cash Flow Per Share, Since 2008, Recessions Shaded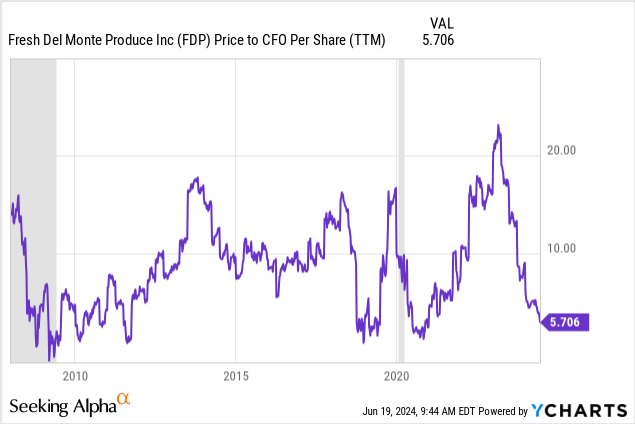
Enterprise valuations on trailing EBITDA during early 2023 were the lowest since the depths of the Great Recession, and forward estimates for 2024-25 place it in the same general range. The forward estimated ratio of 6.48x is a good 40% discount to long-term trading averages.
YCharts – Enterprise Value to EBITDA, Since 2008, Recessions Shaded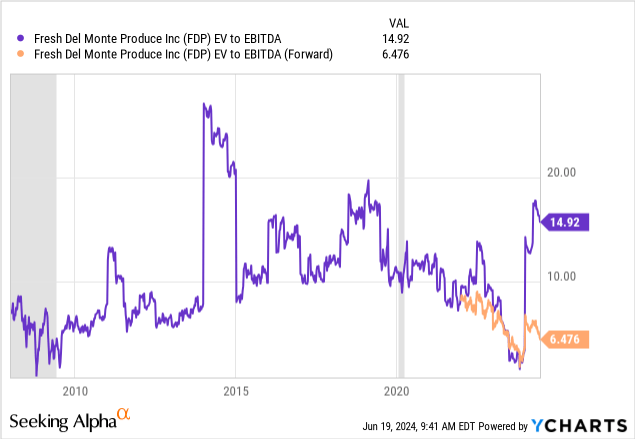
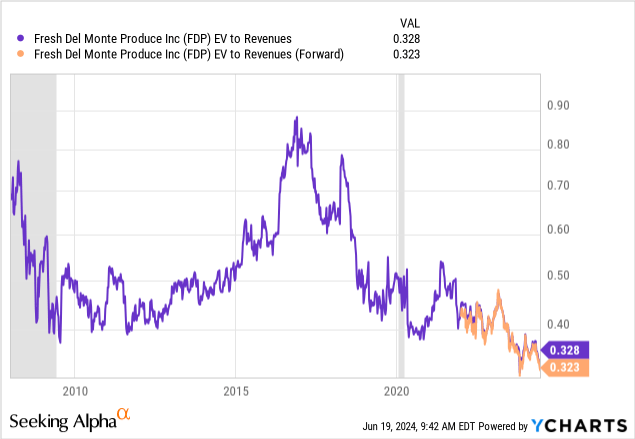
Perhaps the most positive fundamental valuation ownership argument, outside of the tangible book value setup, is price to sales and EV to Revenues are now at LOWER levels than experienced during the Great Recession. Today’s price to sales multiple of 0.24x is a 45% discount, while the EV to Revenues ratio of 0.33x is 35% cheaper than historical averages over many decades. With the S&P 500 priced near all-time high multiples on sales upwards of 3x, why not buy a company reaching for historic lows? Who doesn’t like a bargain?
YCharts – Fresh Del Monte Produce, Price to Trailing Sales, Since 2008, Recessions Shaded YCharts – Enterprise Value to Sales, Since 2008, Recessions Shaded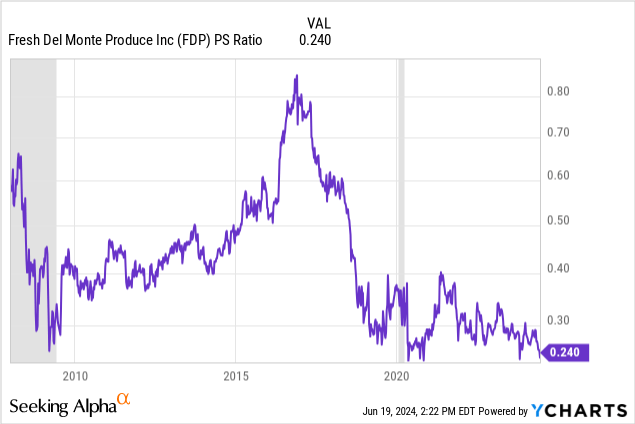
Awesome Dividend Story
But there’s more reason to weigh Fresh Del Monte Produce as a pick for your portfolio. The current 11.7% free cash flow yield on investment is reaching for a 10-year higher. And, this strong level of free cash flow talked management into raising the dividend from $0.80 to $1.00 annually in February. The good news for income investors is EPS in the $2 to $2.50 range projected for 2024-25 should easily cover $1.00 in cash dividend payments far into the future.
YCharts – Fresh Del Monte Produce, Free Cash Flow vs. Dividend Yield, 10 Years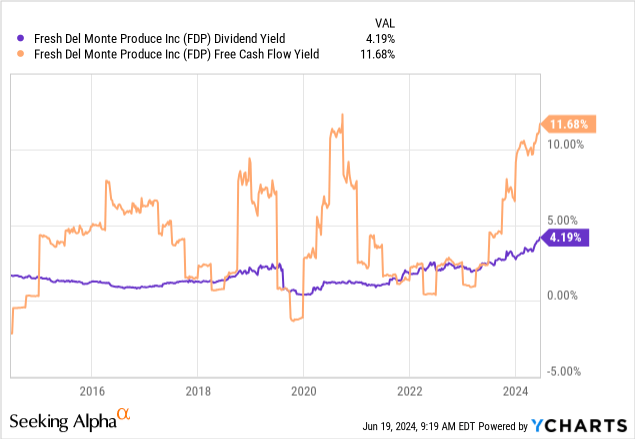
The forward 4.7% yield at $21.50 per share for price puts the dividend yield near the best nominal rate ever, bumping against the 2006 highs. Even better news is the ratio of FDP yield vs. the prevailing S&P 500 index cash distribution rate of 1.23% already puts the stock in its best relative yield position EVER during June 2024.
YCharts – Fresh Del Monte Produce vs. S&P 500 ETF, Dividend Yields, Since 1998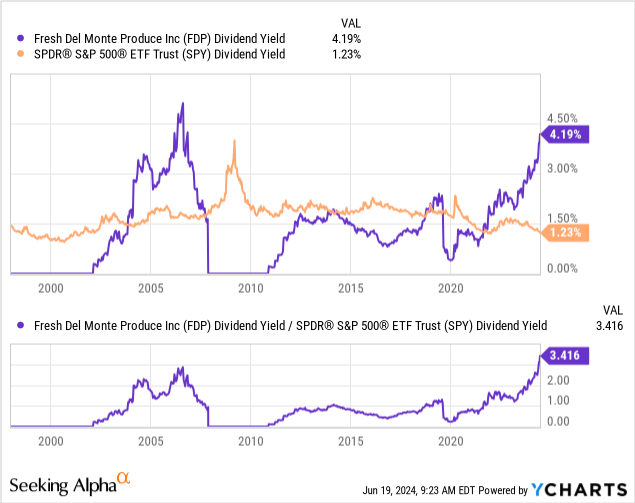
What happened to the stock quote after similar dividend yield highs were reached in the summer of 2006? FDP morphed into a stock under heavy accumulation, with a total return of +146% crushing the equivalent S&P 500 index gain of +13.4%, over the next 21 months. I think a repeat performance has serious odds of playing out again into 2025.
YCharts – Fresh Del Monte Produce vs. S&P 500 ETF, Total Returns, August 2006 to April 2008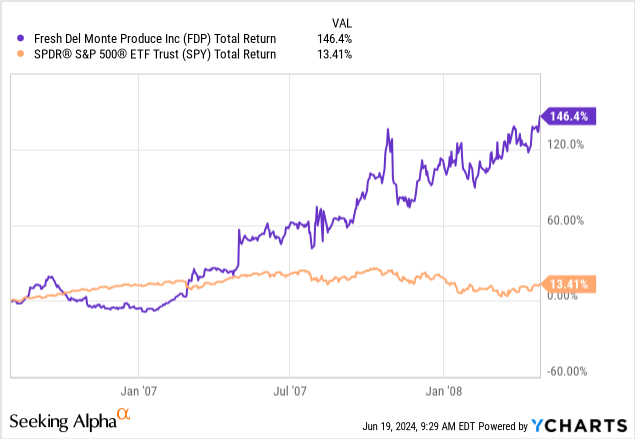
Final Thoughts
I truly love the idea of owning a food producer currently. It’s a clear stagflation play with a rare combination of deep value and above-average dividend yield. The ability to leverage and “pass along” future food price inflation (caused by excessive central bank money printing to keep the U.S. Treasury’s debt from defaulting) as rising earnings and cash flow to shareholders is worth investor consideration. Little debt and interest expense (trailing free cash flow of $120 million vs. net interest expense of $20 million), working alongside a fully integrated (mostly owned asset) business model, means operating costs are largely fixed in nature (outside of labor and energy).
So, upside income leverage to any unexpected advance in fresh produce prices could be as high as 2:1 or possibly 3:1. My thinking is every 10% price increase in future banana, pineapple, melons, grapes, etc. could jump EPS by 20% to 30% for shareholders on a sustainable basis, all other variables remaining the same (i.e. labor costs, energy expenses).
Analyst estimates are calling for a slight downturn in EPS this year, from changing consumer demand trends and lower banana prices over the short term. A resumption in earnings growth is forecasted for next year to $2.49 as a consensus EPS estimate. In terms of upside catalysts, better quarterly performance for June and/or raised management guidance for the rest of the year could reverse the latest share price selloff. The Q2 report is due in early August.
Seeking Alpha Table – Fresh Del Monte Produce, Analyst Estimates for 2024-25, Made June 18th, 2024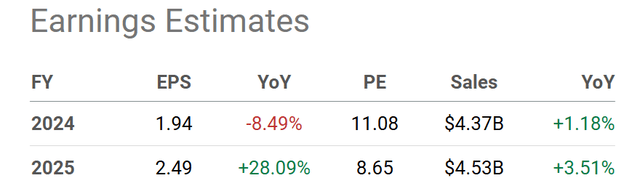
One of the reasons I am so bullish on Fresh Del Monte is there exists plenty of room for profit margin improvement on existing sales. Gross and operating margin levels have zigzagged higher over the last five years, but remain far below the levels of 10 or 20 years ago. If some focused asset sales and cost cutting efforts bear fruit, like I believe they would, EPS of $3.00 or $3.50 annually might be possible in the next food inflation upswing, absent any volume growth in goods sold.
YCharts – Fresh Del Monte Produce, Gross & Operating Margins, Since 2008, Recessions Shaded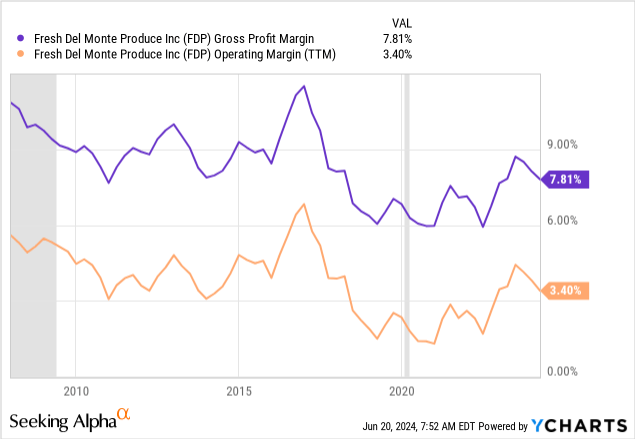
Interestingly, the -20% share price drop from early May seems to be witnessing a high level of net accumulation. I have charted this idea below. It is quite similar to the September to early November trading period (boxed in green), as measured by intraday Accumulation/Distribution Line movements. When price does bottom from the latest selloff, I fully expect a long-term bull move will begin for FDP.
StockCharts.com – Fresh Del Monte Produce, Intraday Trading – 15 Minute Intervals, 12 Months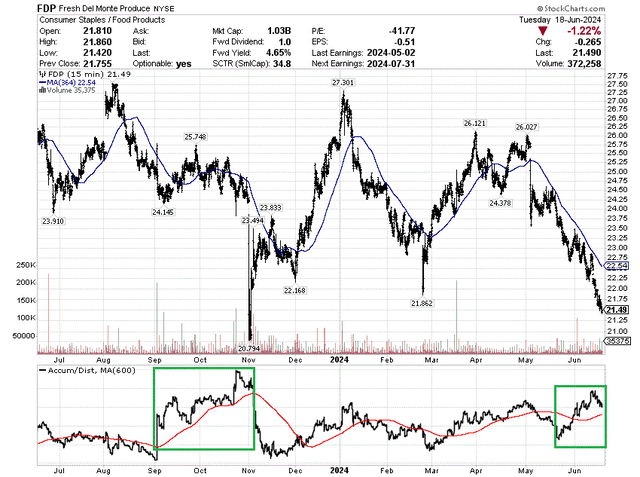
What are the investment risks? My first concern would be a severe economic recession in the U.S. and/or Europe could dampen fresh food consumer demand, as family budgets turn toward cheaper processed alternatives. However, I question how much lower the valuation can fall on a sustainable basis. We would have to experience major food deflation to drive sales and income lower for years.
Another worry for me – management could decide to acquire new assets with debt, overpaying in the process. Any such effort could dilute future operating results and discourage investment in a riskier balance sheet. So, a big upswing in the share pricing of Fresh Del Monte is far from guaranteed.
On the upside, projections of $30 to $40 a share in 12-18 months are not farfetched. $30 a share by the summer of 2025 (+50% total return with dividends) would still bring a lower-than-normal long-term valuation setup, assuming the business continues expanding with limited debt use. For example, $30 would still represent a valuation of 12x to 13x normalized EPS (45% discount to 10-year averages) and 0.35x sales (25% discount on 10-year averages) Wall Street estimates for 2025.
YCharts – Fresh Del Monte Produce, Normalized P/E Ratio, 10 Years 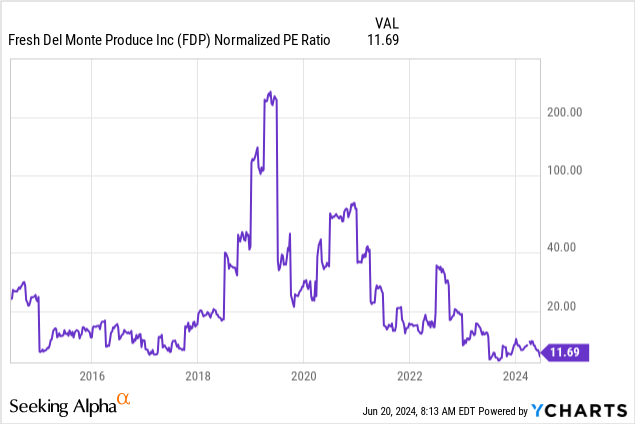
$40 is my back-of-the-envelope asset breakup value. $40 for a price target in 18 months (with +100% in total returns created for buyers today) would put the valuation closer to historical readings, especially if operating growth accelerates. For a more detailed explanation of my breakup value estimate, backed by real estate inflation over the decades, please review my November article here.
To me, the investment reward potential appears to be overwhelming the risk arguments. I rate Fresh Del Monte Produce shares a Strong Buy, and own a decent-sized position. I will say, I plan on increasing my stake on any price drop under $20 over the coming weeks/months.
Thanks for reading. Please consider this article a first step in your due diligence process. Consulting with a registered and experienced investment advisor is recommended before making any trade.
Credit: Source link