
CristinaNixau/iStock Editorial via Getty Images
Frasers Group (OTCPK:SDIPF) is a quality company trading at a significant discount to its historical averages and the sector. The company is well-positioned to take advantage of any recovery in the UK economy with its essential and luxury products lineup. We initiate coverage with a buy rating.
The Company
Frasers Group is one of the UK’s most prominent and diverse sports and fashion retailers. With a market cap of $4.7bn, its main store brands include Sports Direct, House Of Fraser, GAME, and Evans Cycles. They also own clothing and sports brands, including Jack Wills, Slazenger and Gieves & Hawkes.
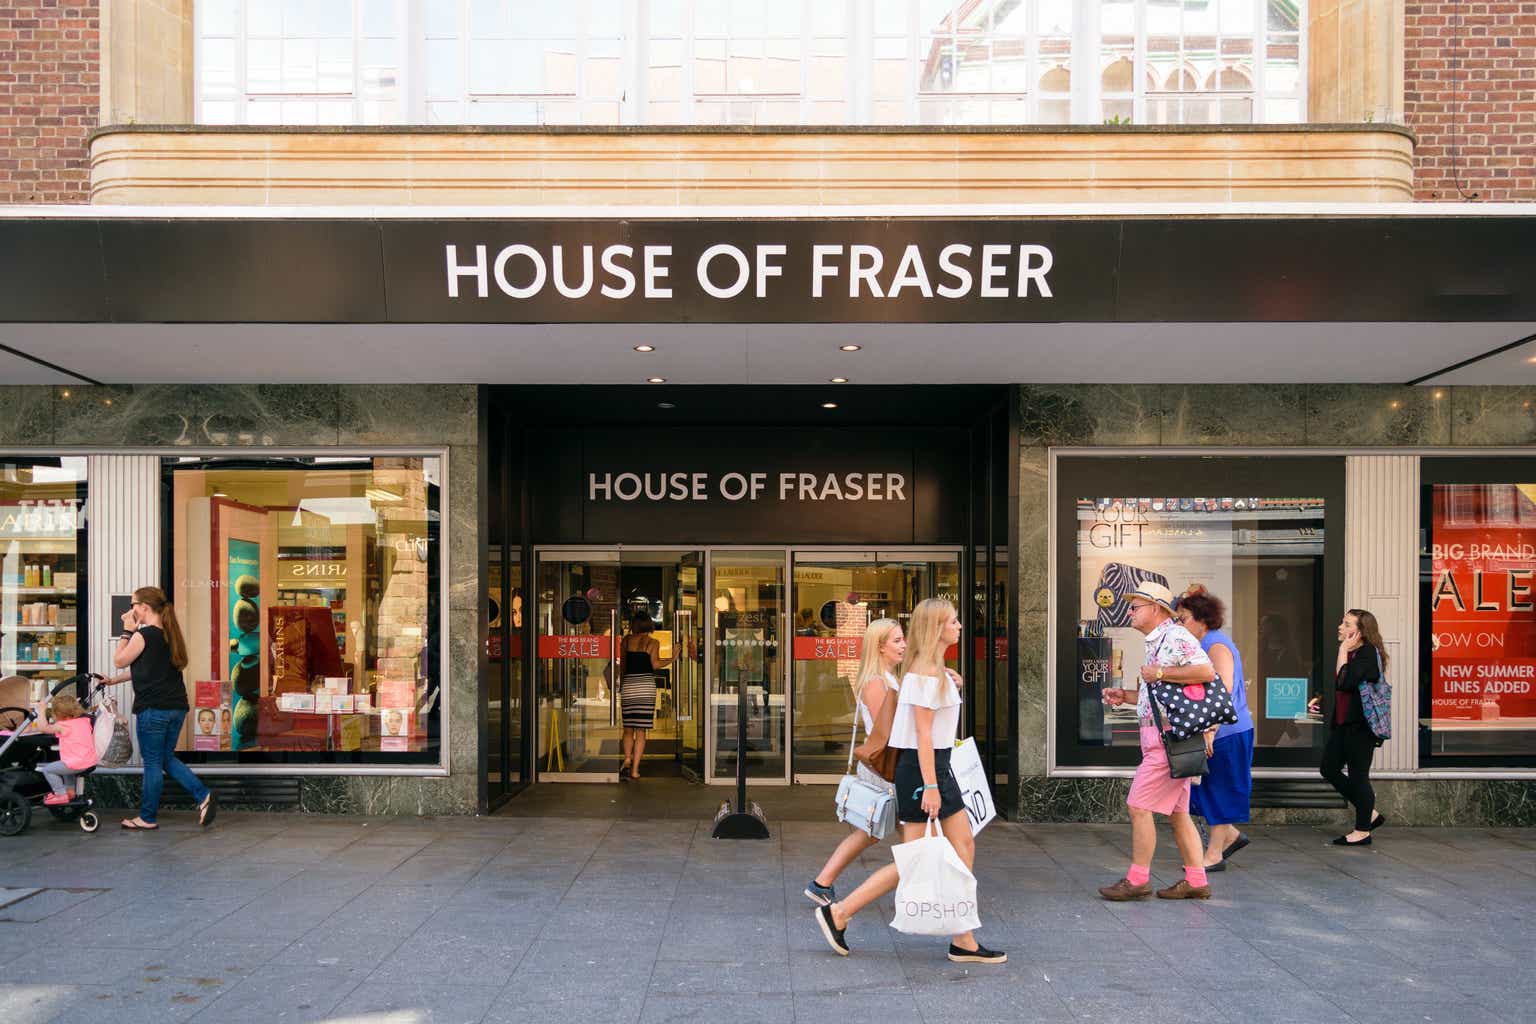
Sports Direct bought the House of Fraser department store chain for £90m ($120m) in 2018 just as it went into administration. The then CEO of Sports Direct, Mike Ashley had said he planned to turn the House of Fraser chain into the “Harrods of the High Street”.
Mike Ashley opened his first sports shop in 1982 and has built a significant multi-billion retail chain. He stepped back from active management in 2022 but still retains a 73% share of the company. The company has an active share repurchase program, and even though the number of shares Mr. Ashley holds has decreased, his holding in the company has increased from approximately 64% since 2014. This can be a deterrent for potential investors, and we would like to see Mike Ashley give up more control of the company. This may be about to change as the company announced it is seeking shareholder approval to acquire 67.5m or 15% of outstanding shares indirectly held by Mr. Ashley. This values the shares at approximately $730m (£556m). As the shares would be canceled, this would reduce the controlling interest of Mr. Ashley’s holdings to approximately 68.5%. We like this trend, however, we would like to see more shares offered to retail investors or block sales to institutional investors.
The group has significant holdings in various other retail and fashion companies.
Fraser Group’s Long-Term Investment Fair Value As of 28 April 2024 (Company Annual Report)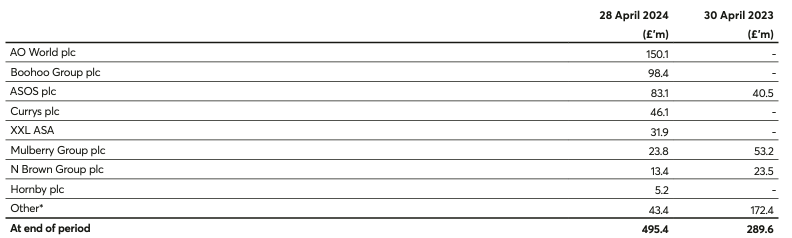
The company continues to strategically invest and increase its holding in some of the above companies and to acquire other smaller assets. On 10 April, they agreed to acquire Twin Sport, a Dutch sports retailer with 17 stores. They also recently acquired Frenchgate, a shopping center in South Yorkshire for $39m (£29.5m). They have also increased their holdings in Hugo Boss, valued at $545m (£415m, €490m). This brings the total investments in other companies to over £1bn ($1.3bn).
The company reports operations in three segments. The largest is UK Sports, which consists of UK-based sports retail and wholesale operations, GAME UK, and all online-related operations. As of the year ending April 2024, It accounts for 51.7% of total revenues. Premium Lifestyle accounts for 21.7% of revenues. Internation (non-UK) retail accounts for a quarter of their revenues.
Financial Analysis
Revenue growth has been healthy at 7.4% 10-year CAGR and a more impressive 15% over the past 3 years. The company has done well to withstand the cost of living crisis in the UK where revenues stalled in FY24.
Fraser Group Growth Profile (Seeking Alpha)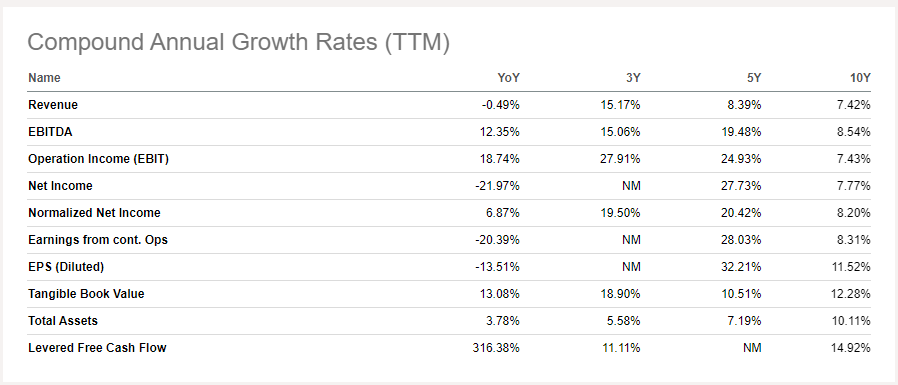
Margins continue to increase from the lows of 2020 and EBITDA margins are at an all-time high of 15%.
Fraser Group EBITDA Margins (ROCGA Research) Fraser Group Share Price Performance (ROCGA Research)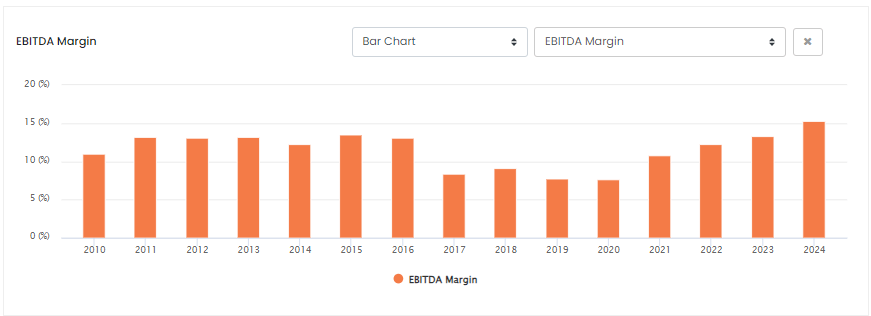

Even though they managed to grow revenues, as margins deteriorated, by the end of 2017 the company lost 70% of its value from its peak in 2016. With improving margins and significantly higher revenue growth, the share prices have recovered over the past few years.
Fraser Group Net Debt to EBITDA (ROCGA Research)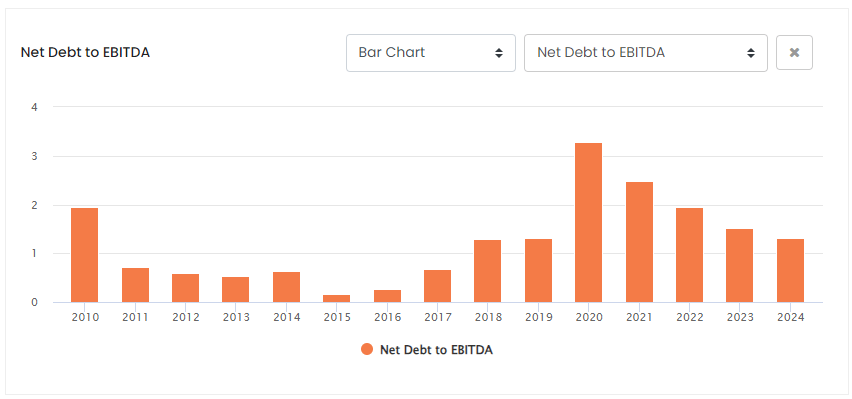
The company balance sheet also strengthened with net debt to EBITDA lower for FY24 from a peak of over 3X to approximately 1.3x. FY24 debt increased slightly from £1,430 to £1,453m, but if we take into account its investment properties, financial assets, and cash & equivalents, net debt improved from FY23 of £701 to £248.
FY24 saw revenues decline slightly with expected weakness in the discretionary market such as in GAME UK, demand for luxury goods, and some planned House of Fraser store closures. The loss of revenue in these markets was offset by strong performance in the core Sports Direct business. Improving product mix in the essentials market by catering to the more cost-conscious customers, strengthening brand relationships, and less of the lower margin sales from GAME Group saw margins improve. Adjusted profits before tax increased 13.1% in FY24 and adjusted EPS was up 34% to £0.96 ($1.3).
The group is working on an Elevation Strategy that encompasses building stronger relationships with brand partners, expanding existing brands, opening new stores to benefit communities, focusing on physical and online store experiences, growth and integration of strategic mergers and acquisitions, strategic investments, and strengthening governance, compliance, and risk management.
With the integration and synergies of its bolt-on acquisitions, and its warehouse automation program further improving efficiency, the company is confident of strong financial performance. For FY25 they expect a mid-point increase in adjusted profits before tax of 10%, in the range of £575m-£625m ($755m to $620). Assuming the tax burden does not change, we estimate EPS to be approximately 10% higher at £1.05.
The UK is expected to recover with a GDP growth of 1% for FY24 and rise further to its long-term average of 1.9% in FY25. Frasers has consolidated and positioned itself to take advantage of the recovery. We expect growth from its well-entrenched core brands and recovery in the luxury market. Consensus estimates revenue growth of approximately 4.5% for FY25 and our estimate for EPS is £1.05.
Frasers is already showing growth in the international market, where revenues grew 3.3% in FY24. This is expected to improve as its acquisition of MySale in Australia and Twin Sport, its Dutch sports retailer begins to register full-year revenues.
Sporting goods and fashion retail operate in very competitive environments. Rivals include similar retail stores, such as JD Sports (OTCPK:JDSPY) in the UK or DICK’s Sporting Goods (DKS) in the US, and also general retailers. General retailers can compete by selling similar product lines or significantly cheaper store-owned brands. There is also risk from online retailers and the threat from brands wanting to sell direct-to-consumers, effectively skipping the middle man. An example of DTC is Skechers (SKX). SKK has increased its DTC revenue from 2018’s 11% of revenues to approximately half in its latest quarter.
The UK economy is growing again, and consumer confidence is returning to normal. If this stalls, consumer’s discretionary spending on sporting and fashion goods will slow. Also, there is always the risk of miscalculating and predicting sporting fashion and shopping patterns.
Valuation
Fraser is a high-quality company showing lowering leverage (Net debt to EBITDA chart above), improving current ratios, better working capital management, higher margins, improvements in asset turnover ratios, and higher returns. Overall, Fraser scores well on quality.
Frasers Quality Snapshot (ROCGA Research)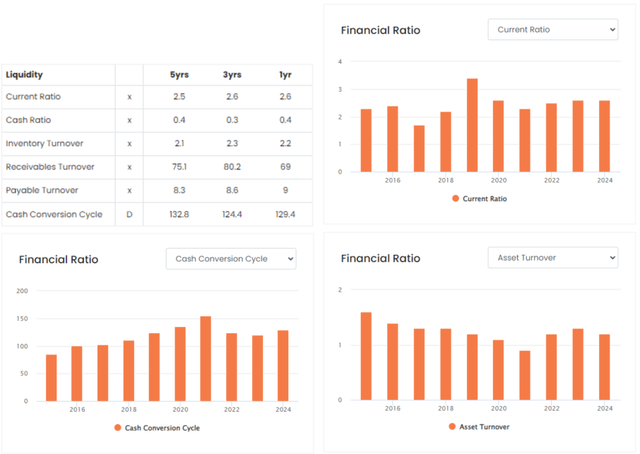
If we compare FY24 numbers with the 5-year averages, we notice the current ratio is a little more healthy at 2.6x compared to 2.5x, the cash conversion cycle was increasing and had reached a peak of 155 days in 2021, but has now come down to 129 days. In 2022, the company broke the declining trend in asset turnover and these have improved. Asset turnover is calculated by dividing revenues by assets. Higher asset turnover indicates the company is generating more revenues per capital invested.
A high-quality company trading on single-digit PE ratios could be a good investment opportunity. Frasers is trading at approximately £8.15 on the London Stocks Exchange, its main listing, and we estimated the FY25 EPS of approximately £1.05, giving us a PE ratio of 7.8x.
Frasers Historic PE Ratio (ROCGA Research)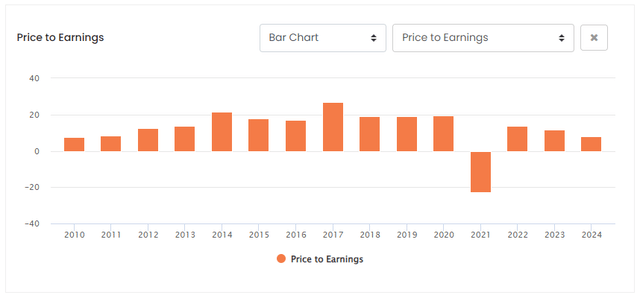
Apart from the losses in 2021, The current FY24 PE ratio is the lowest compared to the past 10 years. Revenues are forecast to start growing again at a similar rate to the sector’s averages. Earnings growth, however, is expected to be higher at 10%, compared to the sector’s 4%. The Non-GAAP FWD PE for the sector is 15.5x and a median of 13.2x for the UK consumer discretionary retail. Given the company’s growth profile, it should be trading at least at par with the sector valuation multiples.
UK consumer discretionary retail (ROCGA Research & Author)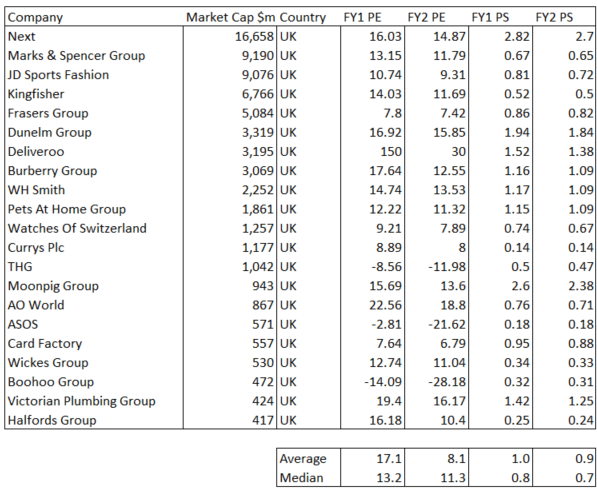
On the list above the closest peer within the UK is JD Sports. Even though it is trading on higher PE ratios than Frasers, it is still trading at a discount to the sector averages. DKS, a similar company to Frasers with similar forecast earnings and revenue growth, and margins profile is trading at a significantly higher Non-GAAP FY25 PE of 14.99x.
With earnings growth expected to be stronger than the sector averages, with PE significantly lower, a recovering UK economy, and consumer confidence returning, we expect Frasers to be trading on higher multiples soon. We initiate with a buy rating.
Editor’s Note: This article discusses one or more securities that do not trade on a major U.S. exchange. Please be aware of the risks associated with these stocks.
Credit: Source link