
• bitcoinBitcoin(BTC)$83,781.000.16%
  • ethereumEthereum(ETH)$2,694.230.12%
  • tetherTether(USDT)$1.000.00%
  • binancecoinBNB(BNB)$767.850.42%
  • rippleXRP(XRP)$1.49-1.43%
  • usd-coinUSDC(USDC)$1.000.01%
  • solanaSolana(SOL)$118.01-1.22%
  • tronTRON(TRX)$0.336497-0.50%
  • Figure HelocFigure Heloc(FIGR_HELOC)$1.03-0.26%
  • zcashZcash(ZEC)$1,411.46-0.21%
  • HyperliquidHyperliquid(HYPE)$89.253.23%
  • dogecoinDogecoin(DOGE)$0.0946250.15%
  • chainlinkChainlink(LINK)$14.31-0.70%
  • moneroMonero(XMR)$547.780.88%
  • whitebitWhiteBIT Coin(WBT)$83.680.11%
  • USDSUSDS(USDS)$1.00-0.05%
  • cardanoCardano(ADA)$0.247271-0.54%
  • RainRain(RAIN)$0.012265-1.31%
  • leo-tokenLEO Token(LEO)$8.84-2.03%
  • stellarStellar(XLM)$0.224299-1.84%
  • nearNEAR Protocol(NEAR)$5.232.57%
  • bitcoin-cashBitcoin Cash(BCH)$307.90-0.81%
  • uniswapUniswap(UNI)$9.082.26%
  • litecoinLitecoin(LTC)$67.270.03%
  • avalanche-2Avalanche(AVAX)$11.10-0.96%
  • CantonCanton(CC)$0.123539-0.67%
  • Ethena USDeEthena USDe(USDE)$1.000.01%
  • suiSui(SUI)$1.16-0.96%
  • hedera-hashgraphHedera(HBAR)$0.105184-1.08%
  • daiDai(DAI)$1.000.01%
  • USD1USD1(USD1)$1.00-0.01%
  • quant-networkQuant(QNT)$292.393.59%
  • the-open-networkGram (prev. Toncoin)(GRAM)$1.500.81%
  • BitwayBitway(BTW)$1.4237.58%
  • BittensorBittensor(TAO)$308.081.18%
  • crypto-com-chainCronos(CRO)$0.0693402.74%
  • shiba-inuShiba Inu(SHIB)$0.000006-1.38%
  • tether-goldTether Gold(XAUT)$4,160.57-0.65%
  • Global DollarGlobal Dollar(USDG)$1.000.00%
  • paypal-usdPayPal USD(PYUSD)$1.00-0.02%
  • EthenaEthena(ENA)$0.261885-0.23%
  • Pump.funPump.fun(PUMP)$0.005569-3.55%
  • aaveAave(AAVE)$164.932.10%
  • okbOKB(OKB)$120.990.07%
  • OndoOndo(ONDO)$0.50-1.27%
  • Circle USYCCircle USYC(USYC)$1.140.01%
  • Ripple USDRipple USD(RLUSD)$1.000.00%
  • MemeCoreMemeCore(M)$1.03-0.79%
  • Ondo US Dollar YieldOndo US Dollar Yield(USDY)$1.150.14%
  • mantleMantle(MNT)$0.690.56%
TradePoint.io
  • Main
  • AI & Technology
  • Stock Charts
  • Market & News
  • Business
  • Finance Tips
  • Trade Tube
  • Blog
  • Shop
No Result
View All Result
TradePoint.io
No Result
View All Result

Franklin Resources (BEN): Mixed Quarter, Valuation Still Not Good Enough

May 23, 2023
in Market & News
Reading Time: 4 mins read
A A
Franklin Resources (BEN): Mixed Quarter, Valuation Still Not Good Enough
ShareShareShareShareShare

pixelfit/E+ via Getty Images

YOU MAY ALSO LIKE

The Coupon That Resets Itself

10-year Treasury yield hits highest level since 2002 as global bond rout gathers pace – cnbc.com

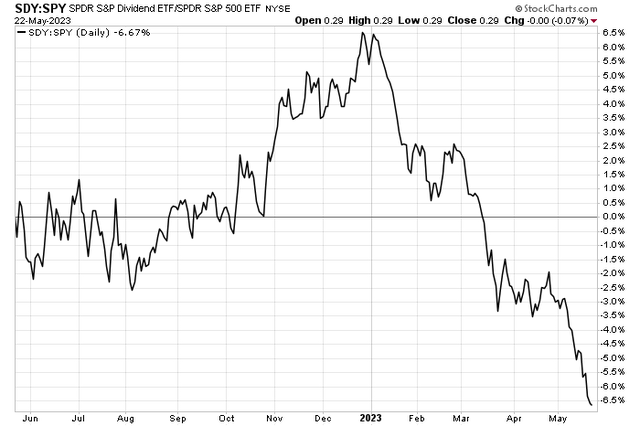
S&P 500 dividend stocks have cratered compared to the broad market. After peaking at the onset of the year, the factor is down about 13 percentage points on SPY when analyzing the performance of the SPDR S&P Dividend ETF (SDY) and the SPX. Among the high-yielders is Franklin Resources (NYSE:BEN). I have a hold rating on the company for weak asset flows (bearish) but also recovering market conditions (bullish), though its chart leans negative.

Dividend Stocks Decline Vs. The S&P 500

Dividend Stocks Decline Vs The S&P 500

StockCharts.com

The California-based $12.3 billion market cap Asset Management and Custody Banks industry company within the Financials sector trades at a low 14.8 trailing 12-month GAAP price-to-earnings ratio and pays a high 4.9% dividend yield, according to The Wall Street Journal.

According to Bank of America Global Research, BEN is a global asset manager with over $1.3Tn in AUM, over 10,000 employees globally, and a presence in six continents. BEN provides investment management services to retail, institutional, and high-net-worth clients globally with capabilities across all asset classes including equities, fixed income, multi-asset, alternatives, and money markets.

Earlier this month, BEN issued Q1 results that had something for the bulls and bears. While revenue fell 7.7% year-on-year, EPS verified above Wall Street expectations due to better net flows across long-term asset classes. Outflows summed to $3.7 billion, better than the nearly $11 billion of outflows reported in the same quarter a year ago. AUM ended Q1 sequentially higher at $1.42 trillion vs. $1.39 trillion in Q4. Then later in the month, Franklin issued its April AUM update, which showed flat asset growth compared to the end of March.

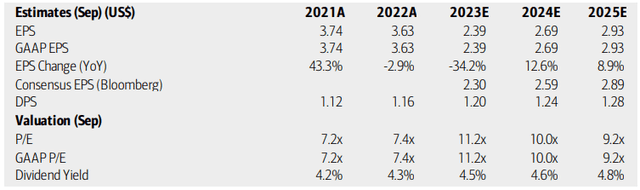
On valuation, analysts at BofA see earnings falling sharply this year before EPS growth returns in 2024 and 2025. The Bloomberg consensus forecast is about on par with what BofA sees. Dividends, meanwhile, are expected to rise at a continued steady pace over the coming quarters. With low earnings multiples following weak share price performance over the past two years, BEN appears to be a compelling value case, but a soft growth outlook is a headwind for the bulls.

Franklin Resources: Earnings, Valuation, Dividend Forecasts

Franklin Resources: Earnings, Valuation, Dividend Forecasts

BofA Global Research
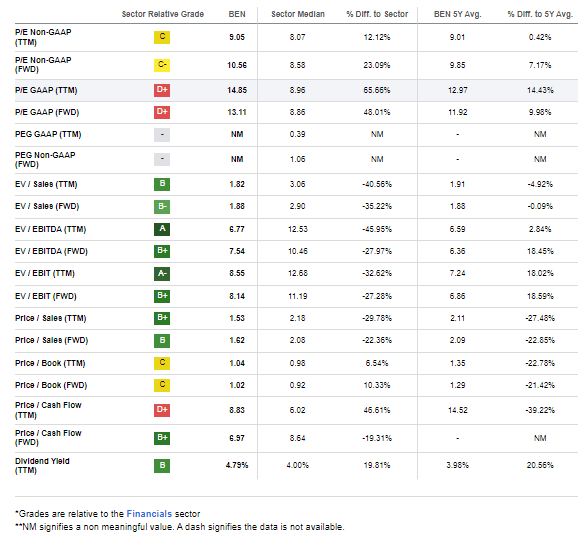
Franklin trades at 13.1 times next year’s earnings, but that is 10% above its 5-year average multiple. On a price-to-book basis, shares look like a better deal at just 1.0x compared to a long-term mean closer to 1.3x. If we apply a P/E closer to the sector median and $2.50 of NTM earnings, then shares should be in the mid-$20s, which is where it trades today. Its next earnings date is slated for July 27 and the next dividend date is June 29.

BEN: Mixed Valuation Metrics, An Above-Sector P/E

BEN: Mixed Valuation Metrics, An Above-Sector P/E

Seeking Alpha
The Technical Take

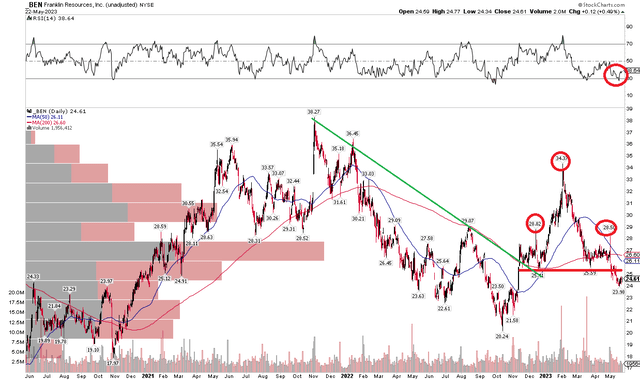
I was neutral on BEN last year due to the lukewarm valuation and poor chart. Notice in the chart below that the share surged from the October low through an early February peak. It was a near-double, but those gains were fleeting. BEN tumbled amid broader Financials sector distress over the back half of Q1. A failed rally to resistance earlier this month leaves the chart vulnerable for further downside.

I spot a bearish head and shoulders pattern, with two shoulders near $28.50 and the head at the 52-week high north of $34. A neckline breakdown a few weeks ago triggered the bearish pattern. What’s more, take a look at the RSI momentum reading at the top of the graph – it confirms a new YTD low in price. I see support at the October low of around $20 – that is also the middle ground of where the stock traded in 2020.

BEN: Bearish Head And Shoulders With RSI Confirmation

BEN: Bearish Head And Shoulders With RSI Confirmation

StockCharts.com
The Bottom Line

I reiterate my hold rating on BEN. The valuation is neutral, and the chart leans bearish. The upside case is that asset prices have recovered, but the company has much to prove.

Credit: Source link

ShareTweetSendSharePin

Related Posts

The Coupon That Resets Itself
Market & News

The Coupon That Resets Itself

October 1, 2026
10-year Treasury yield hits highest level since 2002 as global bond rout gathers pace – cnbc.com
Market & News

10-year Treasury yield hits highest level since 2002 as global bond rout gathers pace – cnbc.com

October 1, 2026
Tim Cook bailed out just in time to avoid the iPhone Duo quagmire – PhoneArena
Market & News

Tim Cook bailed out just in time to avoid the iPhone Duo quagmire – PhoneArena

October 1, 2026
Pennsylvania reports 5th measles-associated death as outbreak continues – The Washington Post
Market & News

Pennsylvania reports 5th measles-associated death as outbreak continues – The Washington Post

October 1, 2026
Next Post
Musk’s Tesla Cyber Rodeo

Musk's Tesla Cyber Rodeo

Leave a Reply Cancel reply

Your email address will not be published. Required fields are marked *

Search

No Result
View All Result
CVS Health Stock Still Looks Good Even If Health Cost Woes Materialize (NYSE:CVS)

CVS Health Stock Still Looks Good Even If Health Cost Woes Materialize (NYSE:CVS)

September 25, 2026
CDC investigates cases of salmonella and E.coli linked to alfalfa sprouts

CDC investigates cases of salmonella and E.coli linked to alfalfa sprouts

September 25, 2026
Secret Service responds to reports of Iranian threat against Trump’s son Barron

Secret Service responds to reports of Iranian threat against Trump’s son Barron

September 24, 2026

About

Learn more

Our Services

Legal

Privacy Policy

Terms of Use

Bloggers

Learn more

Article Links

Contact

Advertise

Ask us anything

©2020- TradePoint.io - All rights reserved!

Tradepoint.io, being just a publishing and technology platform, is not a registered broker-dealer or investment adviser. So we do not provide investment advice. Rather, brokerage services are provided to clients of Tradepoint.io by independent SEC-registered broker-dealers and members of FINRA/SIPC. Every form of investing carries some risk and past performance is not a guarantee of future results. “Tradepoint.io“, “Instant Investing” and “My Trading Tools” are registered trademarks of Apperbuild, LLC.

This website is operated by Apperbuild, LLC. We have no link to any brokerage firm and we do not provide investment advice. Every information and resource we provide is solely for the education of our readers. © 2020 Apperbuild, LLC. All rights reserved.

No Result
View All Result
  • Main
  • AI & Technology
  • Stock Charts
  • Market & News
  • Business
  • Finance Tips
  • Trade Tube
  • Blog
  • Shop

© 2023 - TradePoint.io - All Rights Reserved!