

Martin Barraud
There are ample reasons why some ETF investors ignore market-cap weighted portfolios like the SPDR S&P 500 ETF Trust (SPY) or the iShares Core S&P 500 ETF (IVV). They are top-heavy, over-reliant on trillion-dollar companies, overexposed to tech (defined broadly), etc. One of the alternatives here is to pick a multifactor equity strategy. In the past, I assessed a few vehicles that play with factors to maximize returns, and some were rather successful while others were unfortunately not. Today, I would like to add yet another name to that coverage list.
The Fidelity U.S. Multifactor ETF (NYSEARCA:FLRG) is an example of how a fastidiously calibrated equity strategy can be both relatively inexpensive (an ER of 15 bps) and potent enough to compete with IVV. To corroborate, since its inception, FLRG has delivered one of the strongest risk-adjusted returns in the peer group, beating IVV as well. Its annualized return (unadjusted for volatility) has also been the highest. At the same time, its portfolio definitely has an edge over IVV in terms of value, quality, and low volatility. So I believe that this is a vehicle that investors should shortlist. However, FLRG nonetheless has risks and disadvantages that require due commentary that I would like to provide below in the article.
How is FLRG’s portfolio calibrated?
As we know from its website, FLRG is managed passively, which means its investment decisions depend on the composition of the Fidelity U.S. Multifactor Index.
In the methodology document (as of May 2024) that can be found on the Fidelity website, it is explained that the index
is designed to reflect the performance of stocks of large-capitalization U.S. companies with attractive valuations, high quality profiles, lower volatility than the broader market, and positive momentum signals.
From page 4, we know that the investment universe consists of the “top 1000 U.S. companies based on float adjusted market cap.” To calibrate the index, the composite factor score is calculated, with the factors considered being “value, quality, low volatility, and momentum.” For example, as we know from page 22, the value factor has four equally weighted ingredients, namely the FCF yield, EBITDA/EV, TBV/Price, and “Earnings Over Next Twelve Months to Price.” Top-ranked stocks are selected “within each sector.” In the next step, “equal active weights (i.e., all stocks overweighted by the same amount)” are assigned to them.
The methodology has a sector neutrality principle, which means that it is not to be expected that FLRG’s sector allocations will gravitate much from those of IVV, for example. I will give a bit more details on that below. The index is rebalanced twice a year.
FLRG performance: decent risk-adjusted returns
I would like to compare its performance to the results delivered by a few vehicles, including those that I have and have not covered yet. The first group includes the iShares U.S. Equity Factor ETF (LRGF), the Global X Adaptive U.S. Factor ETF (AUSF), the Invesco Russell 1000 Dynamic Multifactor ETF (OMFL), the WisdomTree U.S. Multifactor Fund ETF (USMF), and the JPMorgan Diversified Return U.S. Equity ETF (JPUS). The second group comprises the Franklin U.S. Large Cap Multifactor Index ETF (FLQL) and the Xtrackers Russell US Multifactor ETF (DEUS). IVV was selected as a benchmark in both.
I decided that the best way to present the findings is to compile two tables covering the following periods:
- October 2020-August 2024 (FLRG was incepted in September 2020),
- June 2022-August 2024, shortened as LRGF changed its strategy in 2022.
Over the first period, FLRG was one of the best as it beat the market (represented by IVV) and most peers, with the exception being only AUSF. Its risk-adjusted returns (Sharpe and Sortino ratios) were also the second strongest in the cohort.
Data from Portfolio Visualizer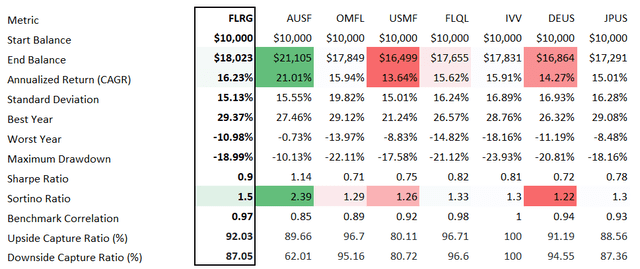
The second period is shorter, and here, FLRG looks less appealing as it underperformed LRGF, AUSF, IVV, and FLQL. But the advantage I see is that it had one of the lowest downside capture ratios in the group, as well as the lowest standard deviation.
Data from Portfolio Visualizer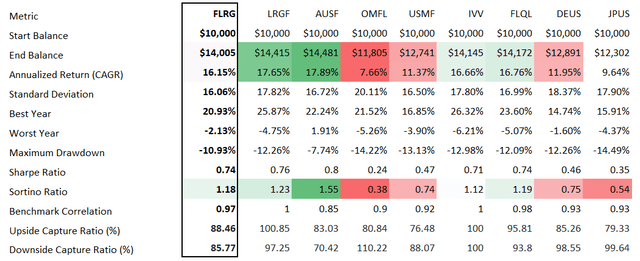
FLRG’s factor mix: an edge over IVV
After reviewing FLRG’s portfolio, I would argue that it does have an edge over the current version of IVV. Its main advantages I have identified include confidently higher quality and better value characteristics. Surprisingly, its growth profile is slightly stronger as well (depending on the method used).
Quality
As of August 29, FLRG’s portfolio is much leaner than that of IVV, with just 101 equities vs. 503 (including dual share classes). This leanness essentially means that FLRG picked only the worthiest companies and filtered low-quality names out. To prove that, I would like to present the following metrics I calculated using data from Seeking Alpha and the ETFs:
| Metric | FLRG | IVV |
| Return on Assets | 15.57% | 14.48% |
| Adjusted Return on Equity | 22.79% | 20.08% |
| Quant Profitability B- or higher | 95.30% | 94.85% |
| Net Margin | 25.69% | 21.42% |
What is interesting is that while FLRG’s sector mix is almost identical to that of IVV (this is because of the sector neutrality principle mentioned above; the most significant difference is that its allocation to IT is 1.2% smaller), sectors represented have much stronger average net income margins compared to IVV, with the only exception being utilities.
Calculated by the author using data from Seeking Alpha and the ETF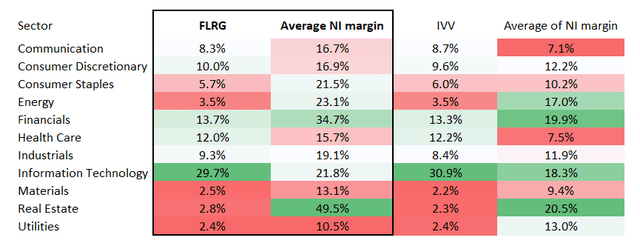
Value and growth
All the metrics I frequently use in the assessment of a portfolio’s valuation characteristics illustrate that FLRG is much more comfortably valued than IVV.
| Metric | IVV | FLRG |
| Market Cap | $963.64 billion | $586.97 billion |
| P/S | 8.02 | 7.97 |
| EV/EBITDA | 23.32 | 21.85 |
| Adjusted EY | 3.73% | 5.29% |
Calculated using data from Seeking Alpha and the ETFs. Financial data as of August 30
One of the reasons here is that FLRG is significantly lighter in the trillion-dollar companies, with just 18.1% allocated to them as it ignored Apple (AAPL), Amazon (AMZN), and Berkshire Hathaway (BRK.B). In IVV, the trillion-dollar league accounts for 31%.
And what is especially surprising here is that better valuation comes with something to appreciate regarding its growth profile as well.
| Metric | IVV | FLRG |
| EPS Fwd | 17.84% | 17.72% |
| Revenue Fwd | 11.92% | 12.28% |
| Quant Growth B- or higher | 39.9% | 36.6% |
Calculated using data from Seeking Alpha and the ETFs
For example, its weighted-average revenue growth rate is slightly higher, with the main contributors being financials, IT, and health care (10%, 9.8%, and 9.4% average forward growth rates, respectively, as per my calculations).
Momentum and volatility
Another important finding that I would like to share is that while having a bit larger exposure to momentum stocks (illustrated by the Quant Momentum grade), FLRG is offering slightly more comfortable weighted-average beta coefficients:
| Metric | IVV | FLRG |
| 24M Beta | 1.06 | 0.96 |
| 60M Beta | 1.05 | 0.94 |
| Quant Momentum B- or higher | 71.90% | 77.50% |
Calculated using data from Seeking Alpha and the ETFs
Final thoughts
For multifactor vehicles that utilize sophisticated factor recipes, it is tough to succeed. However, FLRG did manage to not only calibrate a portfolio with value and quality characteristics stronger than those of IVV but also to outmaneuver this S&P 500 ETF since inception (over the October 2020-August 2024 period, to be precise), leaving less successful peers like USMF, DEUS, etc. far behind. Unfortunately, there are nuances not to ignore.
The key consideration here is that it has a relatively small AUM of just $128.6 million.
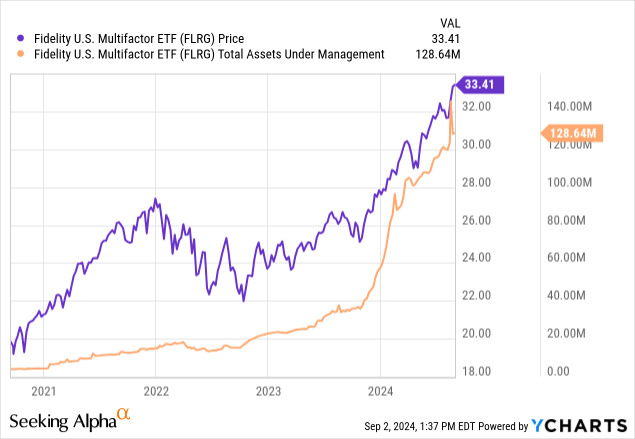
As it can be seen in the chart above, it did see substantial inflows of late, with AUM more than doubling in 2024, which instills confidence that assets might continue growing in the near future, thus reducing the risk of the fund being shut down. However, at this juncture, this is a disadvantage not to ignore.
Another problem that is partly connected to AUM is liquidity, which is far from perfect.
Seeking Alpha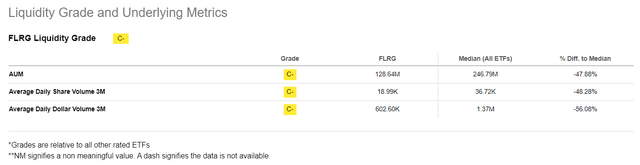
In this regard, even though both performance and factor mix are fairly convincing, and the ETF does deserve to be shortlisted, I would like to opt for a Hold rating today.
Credit: Source link