

Dan Kitwood/Getty Images News
Indian equities have been the pick of global markets through a very turbulent Q3. Flow-of-funds have no doubt played a part, as evidenced by the strong inflows from both foreign and domestic institutions post-election.
Grizzle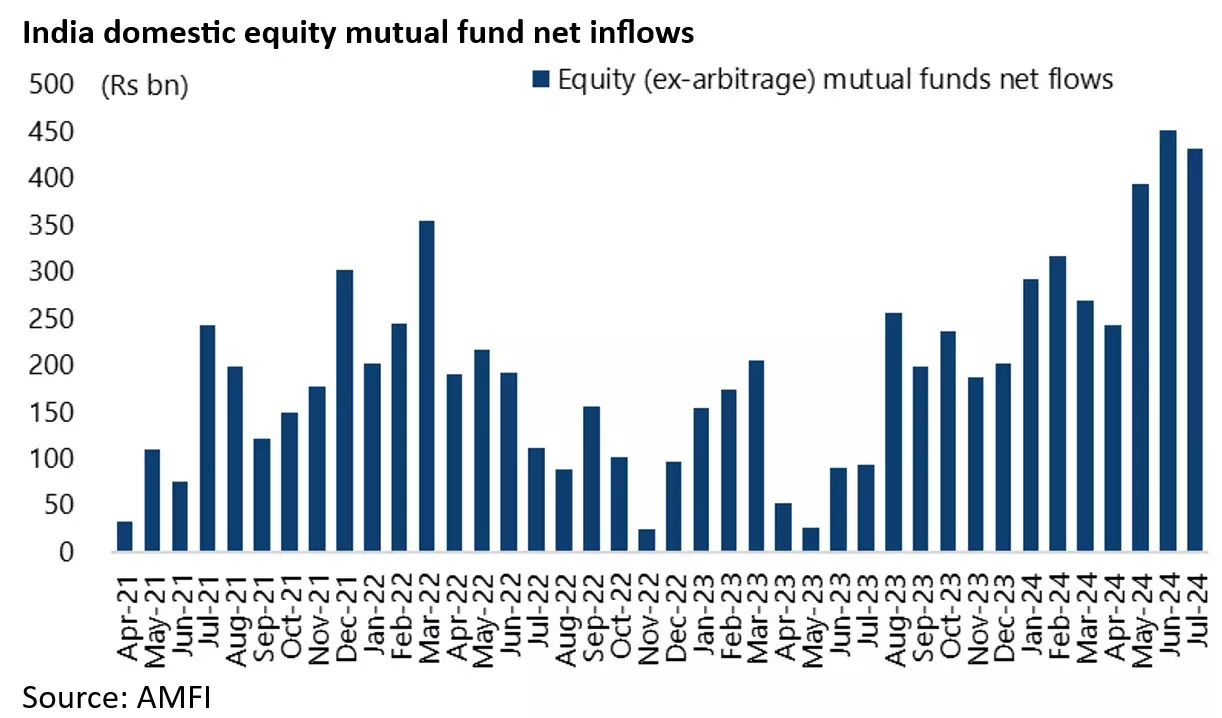
But it’s the fundamentals that ultimately count, and in this regard, India’s growth story remains as compelling as it’s ever been. After all, few (if any) countries are capable of consistently churning out >10% nominal GDP growth prints, never mind sustaining that pace through the next decade.
That said, it is perhaps worth re-underwriting the India case, particularly with headline valuations seemingly at premium levels – both on a historical basis and relative to emerging market peers. And though there have been bright spots, corporate India’s latest earnings season has seen some softening; hence, the slight downward earnings revisions for 2024 (now pacing at +10%).
Yardeni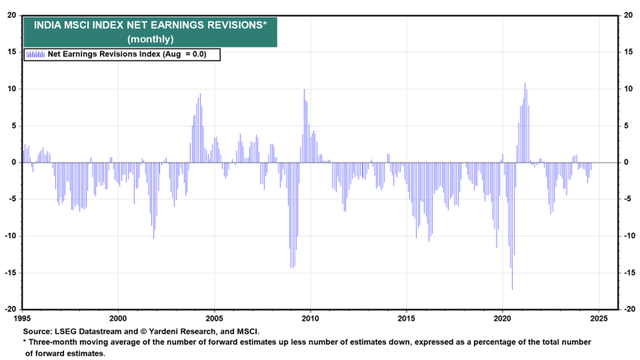
Still, a closer examination suggests it’s well worth staying long Indian equities, with the ultra-low-cost Franklin FTSE India ETF (NYSEARCA:FLIN), in line with my prior coverage (see FLIN: Plenty Of Upside Left In India’s Post-Election Phase) still the standout pick for fee-sensitive investors.
Take the hit to 2024 earnings growth expectations, for instance, which has largely been down to cyclical oil & gas headwinds rather than a domestic slowdown. Zooming out, bellwether names in automobiles, capital goods, and real estate have still outperformed. Also, worth noting is that any dip in this year’s estimates has been offset by upward revisions to the 2025 earnings outlook (currently pacing at +17%). Finally, key forward indicators (favorable monsoon rainfall, expansionary PMIs, etc.) continue to trend well, suggesting that the earnings power of Indian corporates remains firmly intact.
Yardeni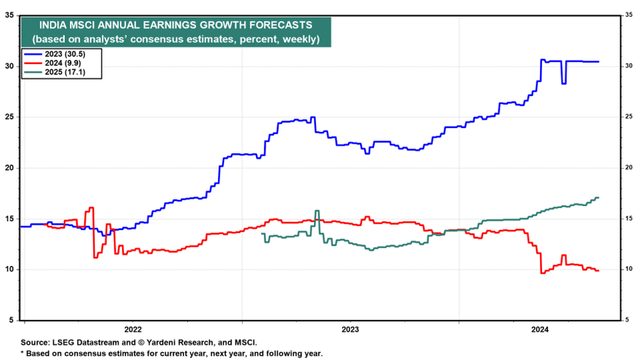
Net, while there are new fund-specific ‘push’ factors to owning FLIN post-Budget, as I outline later in the article, there’s still more than enough ‘pull’ to justify a position here.
FLIN Overview – The AUM Surge Continues
Indian ETFs have seen a wave of inflows in recent months, and Franklin Templeton’s FTSE India ETF has been a key beneficiary. While not quite as big as the largest and most liquid US-listed option, iShares MSCI India ETF (INDA), FLIN does now manage a very significant ~$1.7bn of assets (up from ~$1.3bn last quarter).
Bloomberg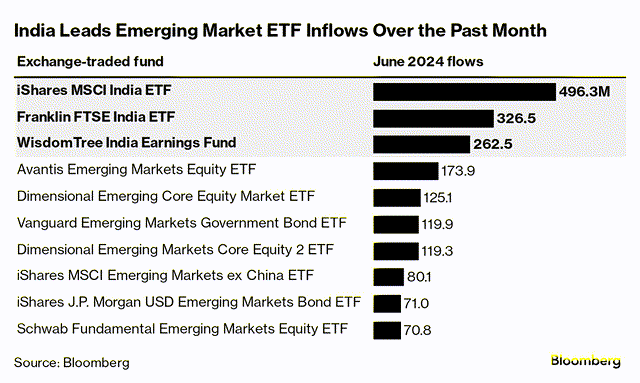
Size tends to beget more trading volumes and liquidity, so it’s no surprise that the fund’s bid/ask spread stands at a very competitive ~5bps. While INDA is still best-in-class here, with a ~2bps bid/ask and over $11bn of assets, FLIN holds its lead over iShares’ other India offering, the iShares India 50 ETF (INDY), and thus, remains best of the rest.
Where FLIN really stands out, even relative to INDA, is its ultra-low ~0.2% expense ratio. Solely from a fee perspective, this makes FLIN the cheapest US-listed vehicle by far – by comparison, large-cap trackers like INDA and INDY charge 0.65% and 0.89%, respectively. Yes, its cost advantage over INDA erodes slightly when you factor in liquidity (see comparison table below); notwithstanding investors moving very large volumes, though, FLIN still ranks right at the top on cost.
|
Net Expense Ratio |
Total Assets |
Median Bid/Ask Spread |
|
|
Franklin FTSE India ETF |
0.19% |
$1.69bn |
0.05% |
|
iShares MSCI India ETF |
0.65% |
$11.4bn |
0.02% |
|
iShares India 50 ETF |
0.89% |
$962m |
0.15% |
Source: Franklin Templeton, iShares
FLIN Portfolio – Slightly Broader and More Diversified than Before
For those who favor diversification, FLIN will rank highly within the Indian large-cap ETF universe. Not only has the fund historically retained the broadest large-cap-focused portfolio, but it has also added two more holdings since last quarter. Note that its 232-stock portfolio is now almost double INDA (146) and more than four times that of 50-stock INDY.
|
Portfolio Holdings |
|
|
Franklin FTSE India ETF |
232 |
|
iShares MSCI India ETF |
146 |
|
iShares India 50 ETF |
50 |
Source: Franklin Templeton, iShares
Adding to the portfolio breadth is a strict weighting policy comprising 1) no more than 20% for any individual holding and 2) a cumulative limit of 48% for all >4.5% single-stock holdings. The result is a less top-heavy sector breakdown for FLIN – even though its composition is broadly in line with INDA and INDY. As for portfolio shifts since last quarter, there’s been a notably increased weighting for Information Technology (by about one percentage point to 11.6%); otherwise, FLIN’s sector allocation remains broadly unchanged.
Franklin Templeton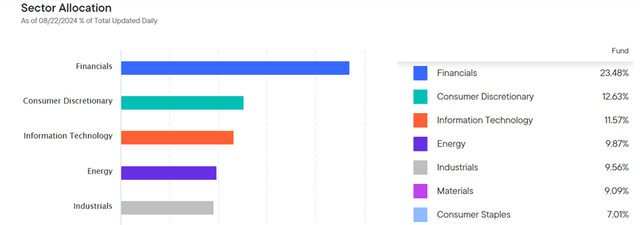
At the single-stock level, both of FLIN’s top holdings, Reliance Industries Limited (RLNIY) and HDFC Bank (HDB), have been trimmed to 6.9% and 6.3%, respectively. In contrast, IT consulting companies Infosys (INFY) and Tata Consultancy Services (TTNQY) were the big gainers – in line with the sector’s recent resurgence. Similarly, Bharti Airtel (BHRQY) (up slightly to 2.8%) and ICICI Bank (IBN) (2.6%) gained portfolio share on the back of their relative outperformance. Also, worth noting is that FLIN’s net long equity exposure is up to ~102% this quarter (attributable to cash & equivalents, derivatives, among others); if the Indian bull market continues, this should add slightly to the fund’s outperformance.
Franklin Templeton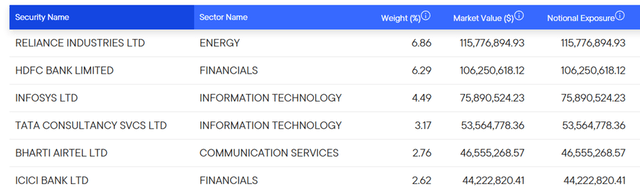
FLIN Performance – Leading the Post-Election Surge; Mind the Tracking Error
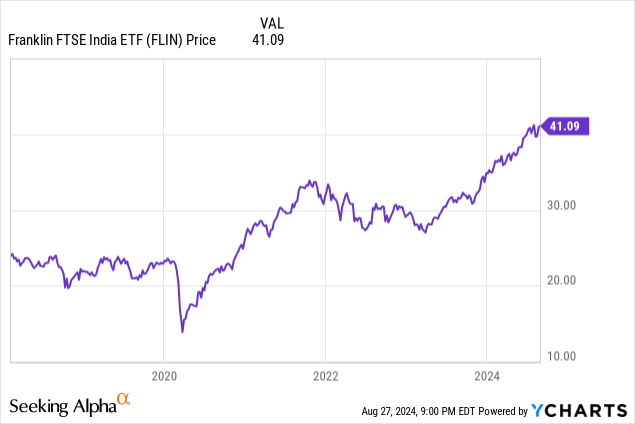
FLIN has built on its strength in Q1/Q2, rallying yet again through a turbulent Q3. As things stand, the fund has now gained +18% year to date – ahead of both INDA (+17%) and INDY (+12%). This year’s outperformance has also notably lifted the fund’s overall track record, which, over an annualized three- and five-year period, are at a best-in-class +12.8% and +14.5%, respectively. By comparison, INDA lags by one or two percentage points, while INDY trails by an even bigger margin over comparable time frames.
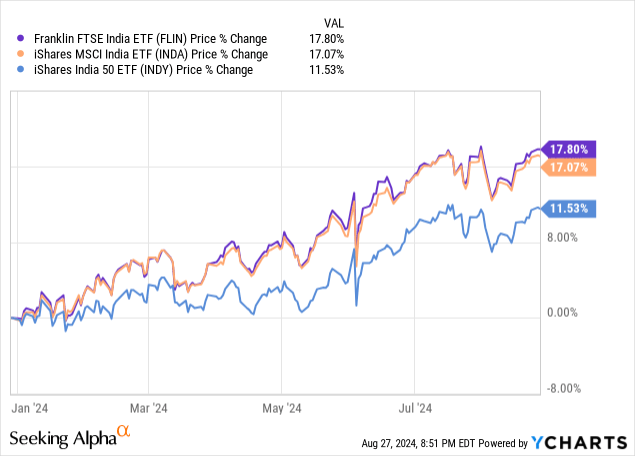
The key to FLIN’s outperformance lies in its broader portfolio vs INDA and INDY; this approach has given the fund more exposure to faster-growing Indian stocks while minimizing its exposure to underperforming mega-caps like HDFC Bank (see HDFC Bank: Focus On Fundamentals Over The Upcoming $2bn Catalyst). Thus, in the likely scenario that the broad-based Indian growth we’ve seen through PM Modi’s last two terms continues, expect FLIN to extend this outperformance into the coming years as well. If we do, on the other hand, see this trend reverse in a bear market, FLIN’s low fee ‘edge’ ensures investors still get a bit of a performance buffer.
For all its pros, though, the one big con for FLIN remains its ability (or lack thereof) to accurately track its benchmark FTSE India Capped Index. This ‘tracking error’ can get particularly wide in bull markets. The one-year performance is a case in point, as FLIN investors have given up eight to nine percentage points relative to the benchmark – well above both INDA (over seven percentage points) and INDY (over five percentage points).
Franklin Templeton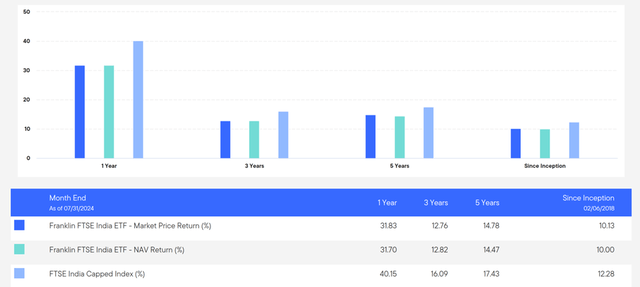
To the manager’s credit, though, FLIN’s tracking error is a lot more competitive relative to peers this year. But given that, to a large extent, tracking errors in India come down to taxes on foreign capital in India, along with high transaction costs, currency fluctuations, and the like, this will remain an unavoidable ‘hidden’ cost in the years to come. There is no silver lining either if the government’s new tax policy on capital gains and securities transactions is any indication. So all things considered, I’d keep a very close eye on how FLIN, along with the other Indian ETFs, navigates this more challenging backdrop going forward.
|
Pre-Budget |
Post-Budget |
|
|
Capital gains tax (Short-Term) |
15% |
20% |
|
Capital gains tax (Long-Term) |
10% |
12.5% |
|
Securities Transaction Tax (Futures) |
0.0125% |
0.02% |
|
Securities Transaction Tax (Options) |
0.0625% |
0.1% |
Source: India 2024 Budget
Riding High on India’s Record-Breaking Rally
India is one of the hottest stock markets in the world right now. Sure, valuations are higher as well, but under the hood, there remains more than enough long-term growth potential for stocks to continue grinding higher. Picking the right vehicle to play India’s growth story is tricky, but for fee-sensitive investors, it doesn’t get much better than FLIN.
Credit: Source link