

FinkAvenue
Introduction
I look at an ETF like the Fidelity U.S. Multifactor ETF (NYSEARCA:FLRG) as an Alpha-generating fund to own on top of a “core” ETF like the SPDR S&P 500 ETF (SPY). If FLRG cannot outperform SPY, in my eyes there is no reason to diversify one’s equity allocation with this ETF. While the results show that isn’t happening, understanding FLRG’s strategy was still worth exploring. While there are enough composition differences between FLRG and SPY to results in outperformance, other than less risk, FLRG, at this point, only gets a Hold rating either as a SPY substitute or an Alpha-generating ETF.
Fidelity U.S. Multifactor ETF review
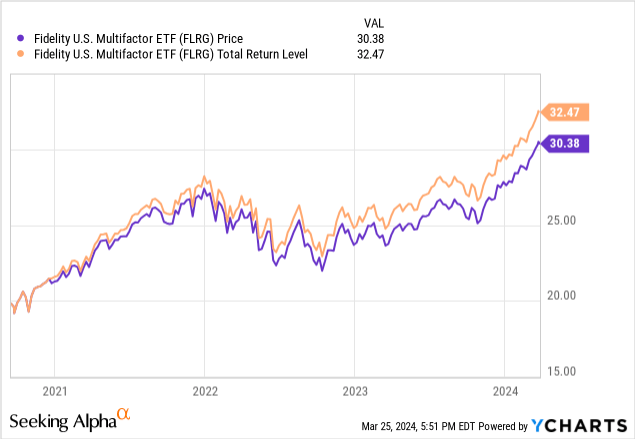
Seeking Alpha describes this ETF as:
Fidelity U.S. Multifactor ETF is an exchange traded fund launched and managed by Fidelity Management & Research Company LLC. The fund is co-managed by Geode Capital Management, LLC. The fund invests in public equity markets of the United States. It invests in stocks of companies operating across diversified sectors. The fund invests in momentum and less volatile stocks of companies across diversified market capitalization. It seeks to track the performance of the Fidelity U.S. Multifactor Index. The ETF started in 2020.
Source: seekingalpha.com FLRG
FLRG has $103m in AUM and comes with a respectable 15bps in fees. The TTM yield shows at 1.26% but recent quarterly payments are not consistent.
Index review
The S&P developed index is described as:
Fidelity U.S. Multifactor Index is designed to reflect the performance of stocks of large-capitalization U.S. companies with attractive valuations, high quality profiles, lower volatility than the broader market, and positive momentum signals.
Source: spglobal.com
The Index market-cap data looks like this:
- Largest Market Cap: $3,074,280.85
- Smallest Market Cap: $4,463.08
- Mean Market Cap: $184,942.72
- Median Market Cap: $43,095.83
Holdings review
My review will start with the important sector allocations, which later will be compared against SPY’s.
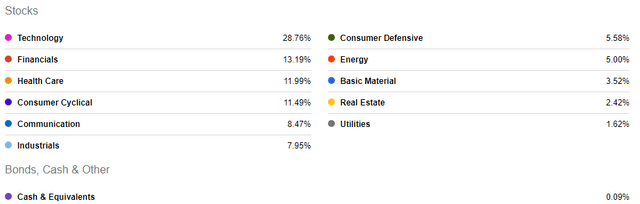
seekingalpha.com sectors.
Like SPY, Technology stocks dominate FLRG’s allocation too. Fidelity provides industry level allocations; six of which have 5+% weights.
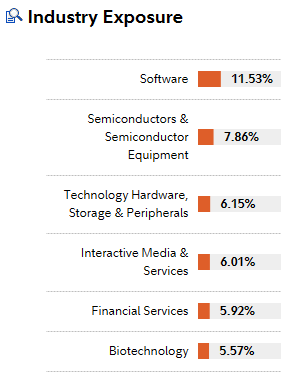
digital.fidelity.com industry data
I will leave the market-cap analysis for when the two ETFs are compared later.
Top holdings
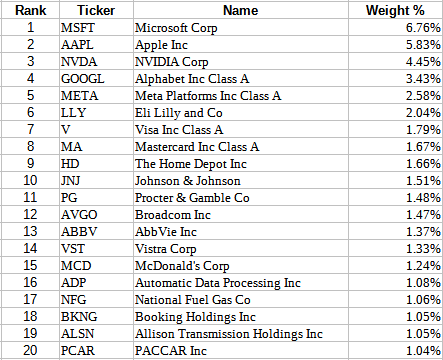
digital.fidelity.com holdings data
The Top 20, out of 100 positions, equate to 44% of the total weight, or as much as the smallest 66 positions provide. SPY’s weight in the same Top 3 securities, despite holding 5X positions, is actually higher, which illustrates how a multifactor selection process can affect individual stock weights.
Distributions review
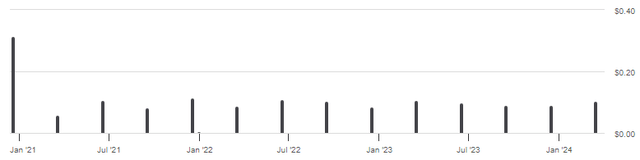
seekingalpha.com DVDs
Quarterly payouts, ignoring the first payment, have ranged from $.06 to a high of $.114, with the last at $.104. Using that level, the FWD yield would be about 1.4%, not an ETF for income seekers.
Comparing against SPY
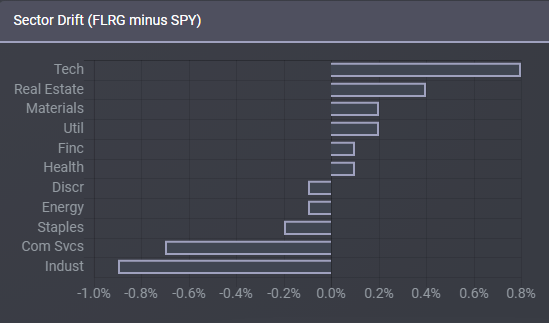
I start this analysis by comparing how the two ETFs are currently allocated across the equity sectors, which shows no weighting difference greater than 1%.
ETFRC.com compare
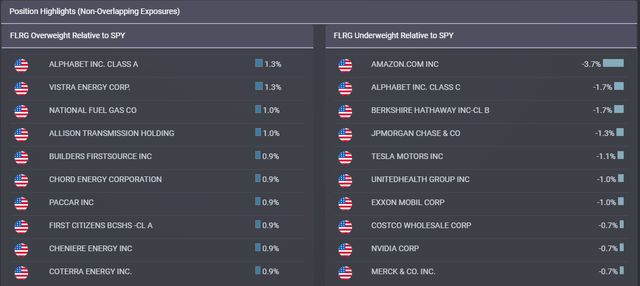
Translation: unless the stock allocations differ by wider margins, the FLRG ETF is just SPY in disguise. The next chart helps answer that second question.
ETFRC.com overlap
This shows that maybe FLRG differs enough to generate Alpha compared to SPY, thus making it worth considering. When looking at its holdings, only 74 of FLRG’s 100 stocks are owned by SPY; market-cap overlap is at 40%; meaning two more reasons that FLRG might be able to outperform SPY. Using Fidelity data, I was able to isolate the stocks held by FLRG that are not in SPY, which account for 18% of FLRG’s portfolio composition. The top five stocks are:
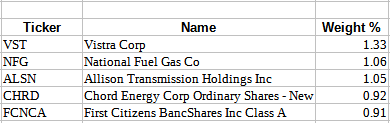
Fidelity.com; compiled by Author
I suspected most of the non-SPY stocks are in the Mid-Cap range and another ETF comparison source confirms that.
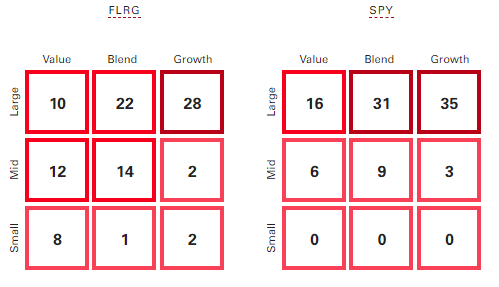
advisors.vanguard.com compare
Here we see a market-cap shift both downward and toward Value stocks using FLRG’s selection/weighting process. This adds two more possible reasons FLRG could add Alpha compared to SPY but does weaken the concept that it is a possible SPY “replacement” ETF. FLRG market-cap and Value/Growth allocations better match up against the Vanguard Total Stock Market ETF (VTI) than to SPY’s.
Looking at data thru the end of February, we see the following.
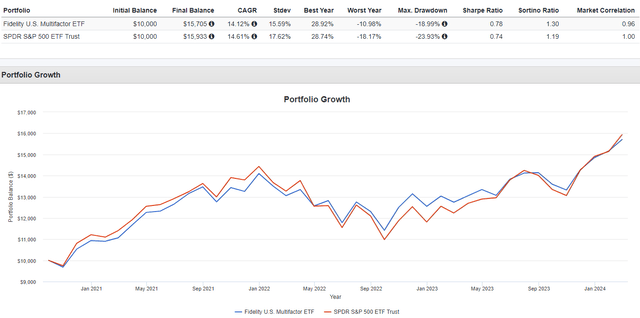
portfoliovisualizer.com
The two ETFs have produced a 96% correlation factor since FLRG started in late 2020. FLRG, while currently trailing in cumulative CAGR, does have higher Sharpe and Sortino ratios thanks to a lower StdDev. Looking at calendar data shows the investment approach used by FLRG is better during down markets and less effective in up markets when compared to SPY.
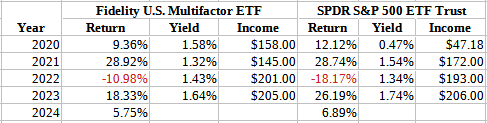
portfoliovisualizer.com; compiled by Author
Granted, the limited history dampens that conclusion.
Portfolio strategy
I build my portfolio strategy around the concept there are certain ETFs, like SPY or VTI, that make great “Core” ETFs, with VTI being my largest holdings (article link). Based on the article’s read count, other Seeking Alpha readers seem to agree. I would classify SPY as another “Core” holding, whereas FLRG would be what I label an “Alpha” ETF; one that is held with the idea that its narrower strategy or active management approach will consistently outperforming (adding alpha) to my portfolio mix when compared to the “Core” ETF that it matches up against best. For FLRG, that could be either SPY or VTI based on the market-cap allocation of the Fidelity ETF.
Conclusion
While there are enough composition differences between FLRG and SPY to results in outperformance, other than less risk, FLRG, at this point, only gets a Hold rating either as a SPY substitute or an Alpha-generating ETF.
Final thoughts
I have never been a fan of ETFs that try to combine multiple factors into one strategy. Some use two, FLRG went “hog wild” and combined four. Somewhere in their “black box”, comprises have to be made when evaluating or weighting each factor. I remember writing factor optimization models in a MBA class. Twenty students, twenty different results as the designs were slightly different. As I said, not a fan.
Credit: Source link