

















• bitcoinBitcoin(BTC)$80,947.000.45%
  • ethereumEthereum(ETH)$2,342.880.30%
  • tetherTether(USDT)$1.000.00%
  • binancecoinBNB(BNB)$745.79-0.24%
  • rippleXRP(XRP)$1.29-1.66%
  • usd-coinUSDC(USDC)$1.000.00%
  • solanaSolana(SOL)$101.320.18%
  • tronTRON(TRX)$0.3310580.40%
  • Figure HelocFigure Heloc(FIGR_HELOC)$1.052.47%
  • zcashZcash(ZEC)$1,345.825.41%
  • HyperliquidHyperliquid(HYPE)$94.9618.42%
  • dogecoinDogecoin(DOGE)$0.0797571.04%
  • moneroMonero(XMR)$603.06-0.24%
  • USDSUSDS(USDS)$1.000.01%
  • whitebitWhiteBIT Coin(WBT)$77.670.41%
  • chainlinkChainlink(LINK)$11.762.20%
  • leo-tokenLEO Token(LEO)$9.460.69%
  • cardanoCardano(ADA)$0.2038801.08%
  • stellarStellar(XLM)$0.1710790.78%
  • nearNEAR Protocol(NEAR)$4.52-1.25%
  • bitcoin-cashBitcoin Cash(BCH)$289.471.55%
  • RainRain(RAIN)$0.006458-7.03%
  • daiDai(DAI)$1.000.02%
  • uniswapUniswap(UNI)$7.283.34%
  • Ethena USDeEthena USDe(USDE)$1.00-0.02%
  • litecoinLitecoin(LTC)$58.09-0.74%
  • CantonCanton(CC)$0.1018531.93%
  • avalanche-2Avalanche(AVAX)$8.890.68%
  • USD1USD1(USD1)$1.000.01%
  • suiSui(SUI)$0.941.66%
  • the-open-networkGram (prev. Toncoin)(GRAM)$1.22-1.03%
  • hedera-hashgraphHedera(HBAR)$0.073854-1.27%
  • tether-goldTether Gold(XAUT)$4,012.26-0.53%
  • Global DollarGlobal Dollar(USDG)$1.000.00%
  • BittensorBittensor(TAO)$255.251.29%
  • paypal-usdPayPal USD(PYUSD)$1.000.00%
  • shiba-inuShiba Inu(SHIB)$0.0000051.63%
  • EthenaEthena(ENA)$0.2133988.76%
  • quant-networkQuant(QNT)$193.91-0.09%
  • crypto-com-chainCronos(CRO)$0.0532530.31%
  • Ripple USDRipple USD(RLUSD)$1.000.00%
  • Ondo US Dollar YieldOndo US Dollar Yield(USDY)$1.15-0.26%
  • okbOKB(OKB)$113.393.12%
  • MemeCoreMemeCore(M)$1.04-7.41%
  • Circle USYCCircle USYC(USYC)$1.140.01%
  • BitwayBitway(BTW)$1.55-10.88%
  • pepePepe(PEPE)$0.00000510.70%
  • BlackRock USD Institutional Digital Liquidity FundBlackRock USD Institutional Digital Liquidity Fund(BUIDL)$1.000.00%
  • aaveAave(AAVE)$134.562.31%
  • Pump.funPump.fun(PUMP)$0.0045037.10%
TradePoint.io
  • Main
  • AI & Technology
  • Stock Charts
  • Market & News
  • Business
  • Finance Tips
  • Trade Tube
  • Blog
  • Shop
No Result
View All Result
TradePoint.io
No Result
View All Result

Federal Budget: May Deficit Soars To Almost 3x Above Average

June 14, 2024
in Market & News
Reading Time: 4 mins read
A A
Federal Budget: May Deficit Soars To Almost 3x Above Average
ShareShareShareShareShare

MattZ90/iStock via Getty Images

YOU MAY ALSO LIKE

New conspiracy charge filed against Venezuela’s Nicolás Maduro

Playwright and star of ‘School Girls’ on bringing their show to Broadway

By SchiffGold

The Federal Government publishes the spending and revenue numbers on a monthly basis. The charts and tables below give an in-depth review of the Federal Budget, showing where the money is coming from, where it is going, and the surplus or deficit.

This month saw a $347B deficit, the largest monthly deficit since March of 2023.

Figure: 1 Monthly Federal Budget
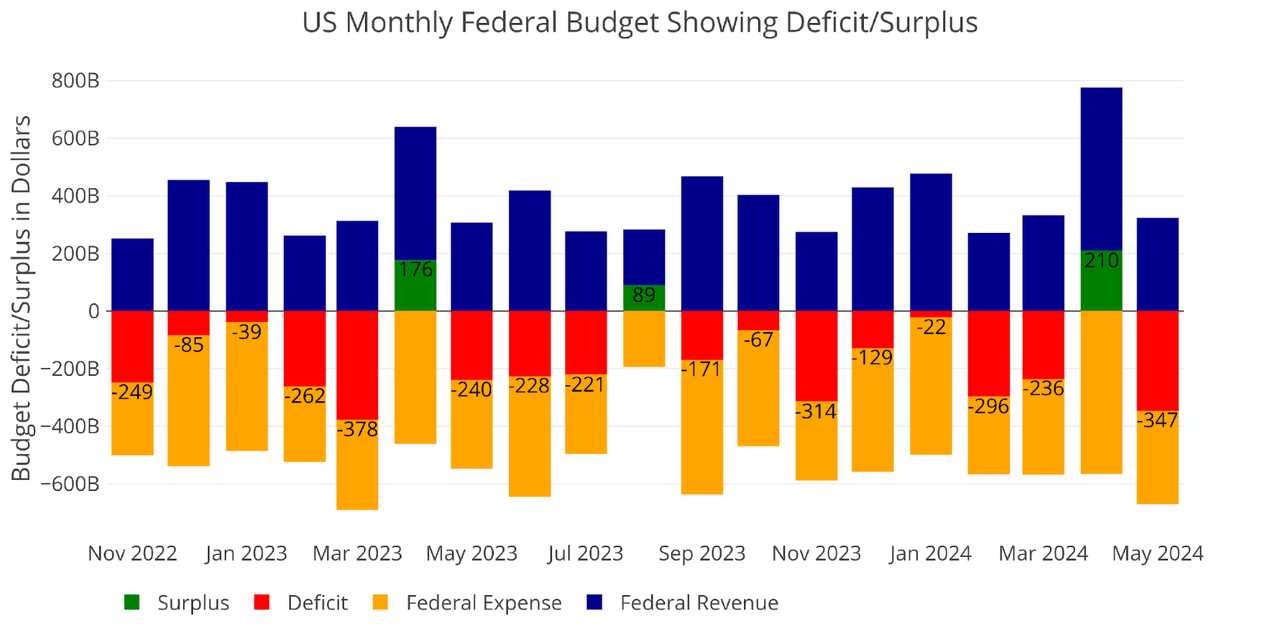
Figure: 1 Monthly Federal Budget

This was also the second-largest May ever, only behind May 2020 during the very depths of the pandemic.

Figure: 2 Historical Deficit/Surplus for May
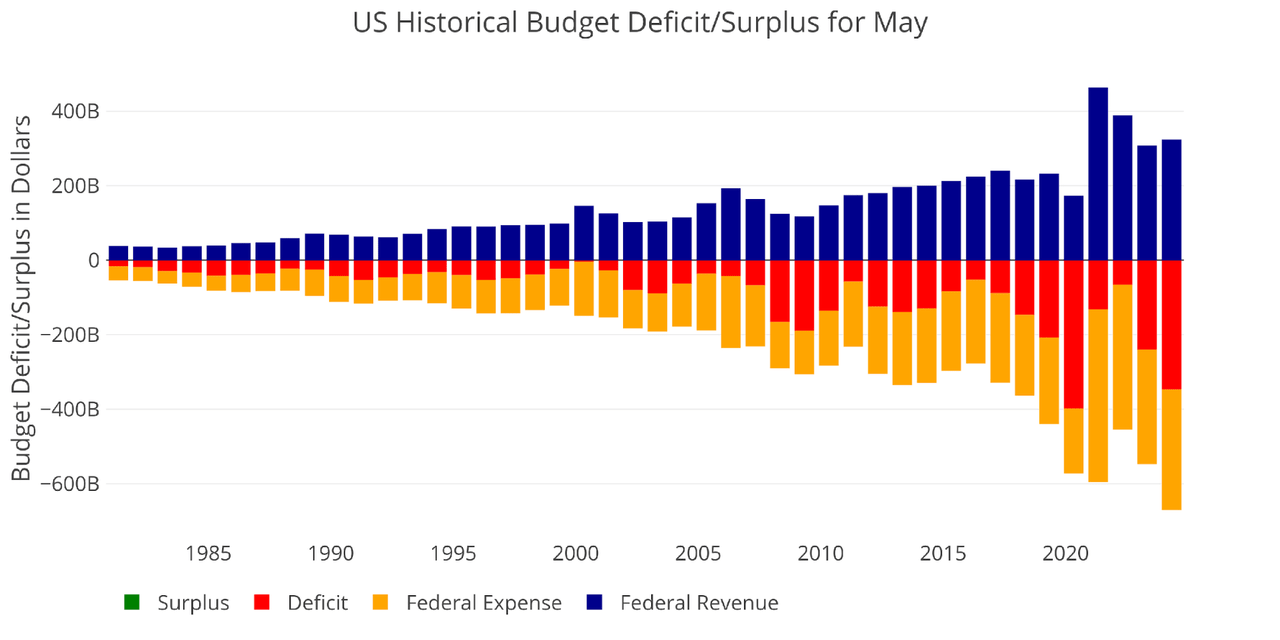
Figure: 2 Historical Deficit/Surplus for May

On average, May experiences a deficit of -$127B, which makes this year almost 3x larger than typical May deficits!

Figure: 3 Current vs Historical
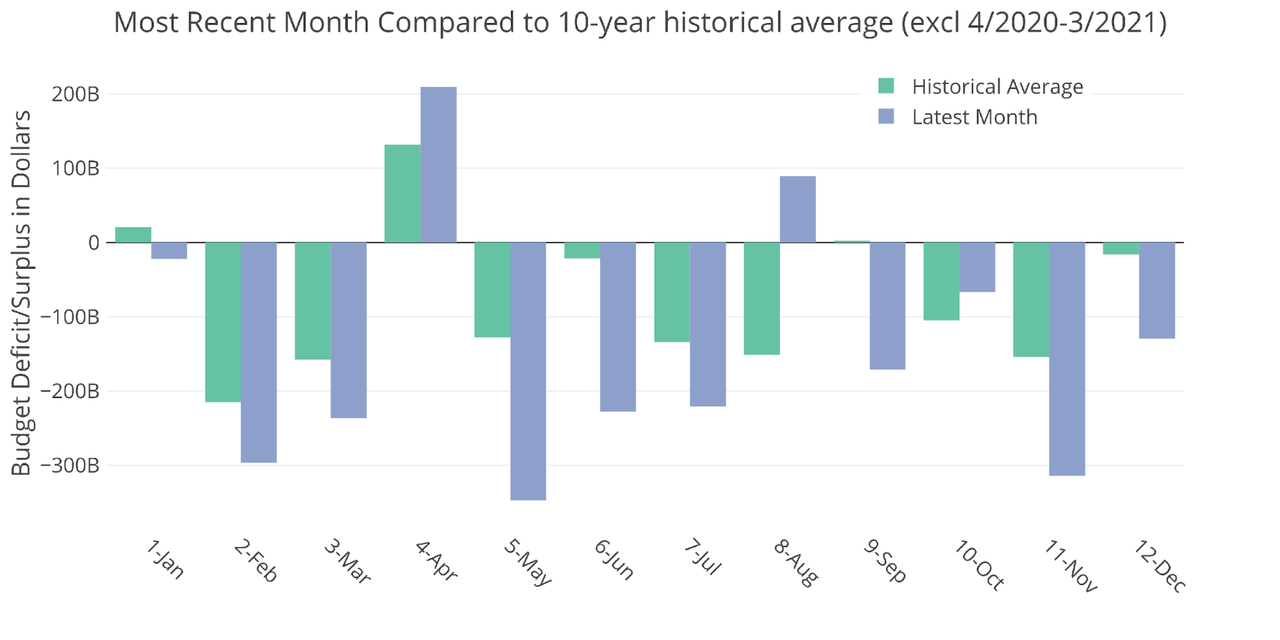
Figure: 3 Current vs Historical

The two Sankey diagrams below show the distribution of spending and revenue for the month and the trailing twelve-month.

Figure: 4 Monthly Federal Budget Sankey

Figure: 4 Monthly Federal Budget Sankey

Figure: 5 TTM Federal Budget Sankey
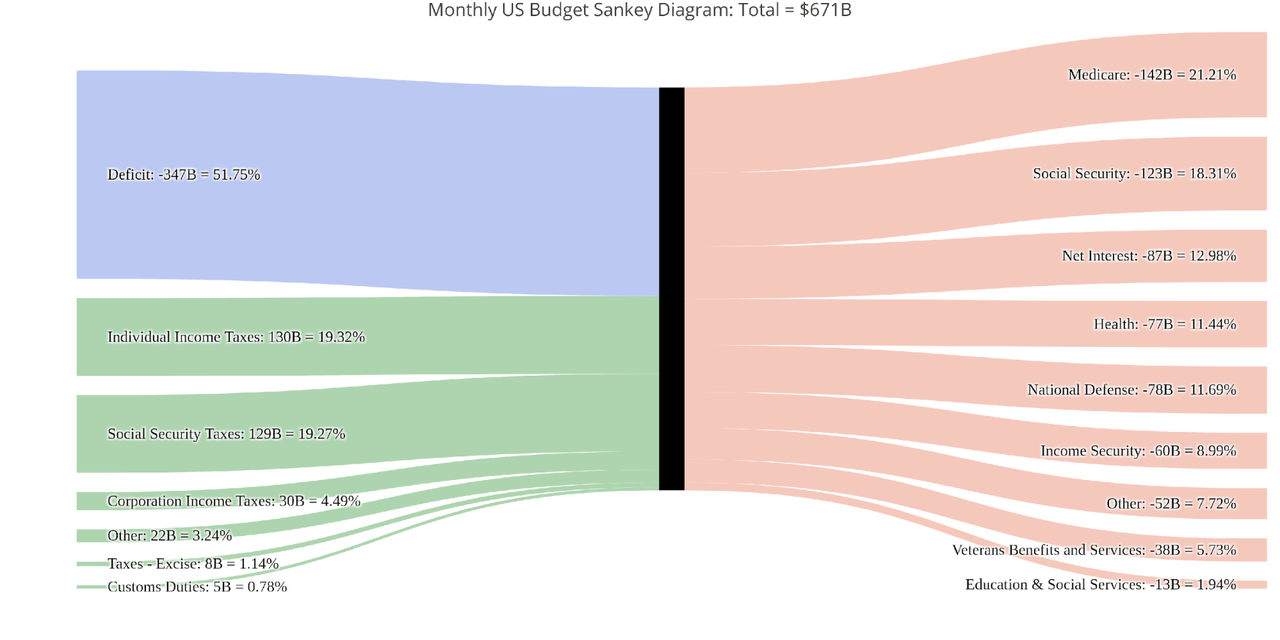
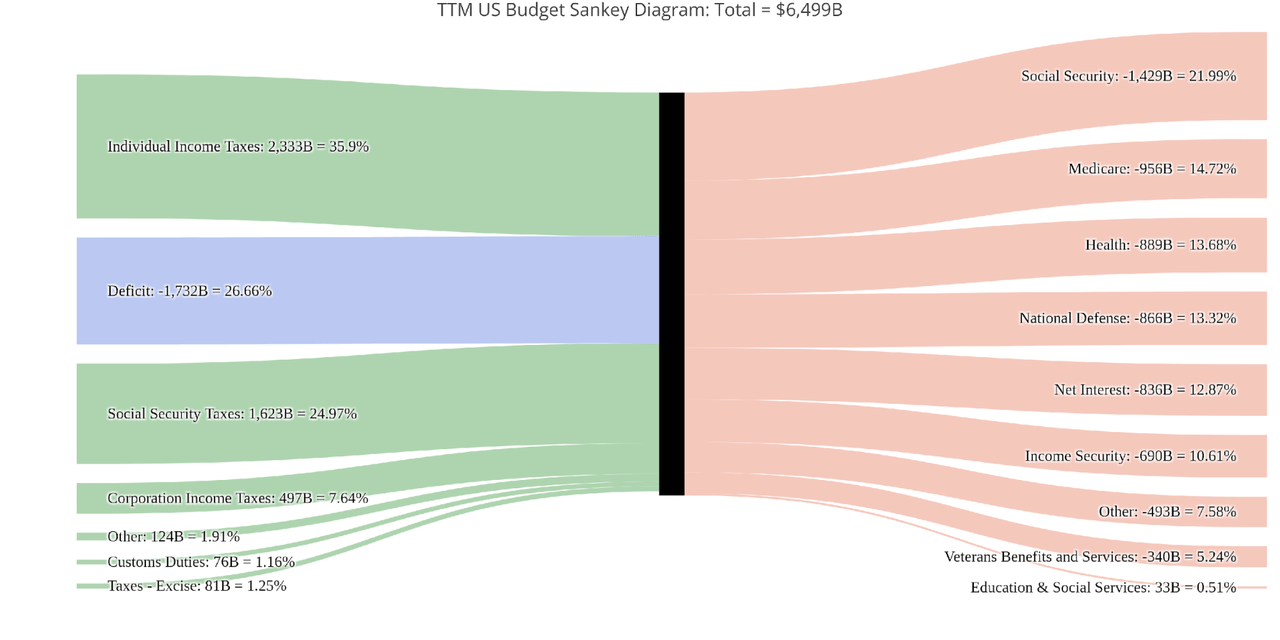
Figure: 5 TTM Federal Budget Sankey

The next two charts show the monthly revenue and costs broken down by expense type.

Figure: 6 Monthly Receipts
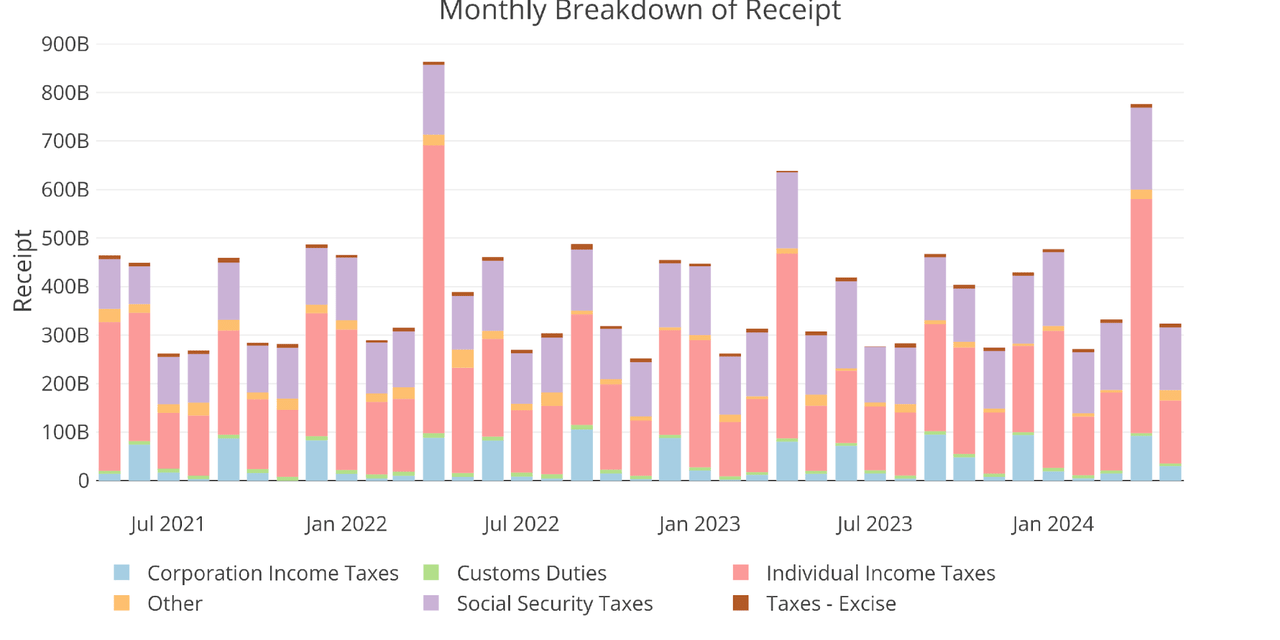
Figure: 6 Monthly Receipts

The chart below shows how Medicare was a big driver of the larger deficit this year.

Figure: 7 Monthly Outlays
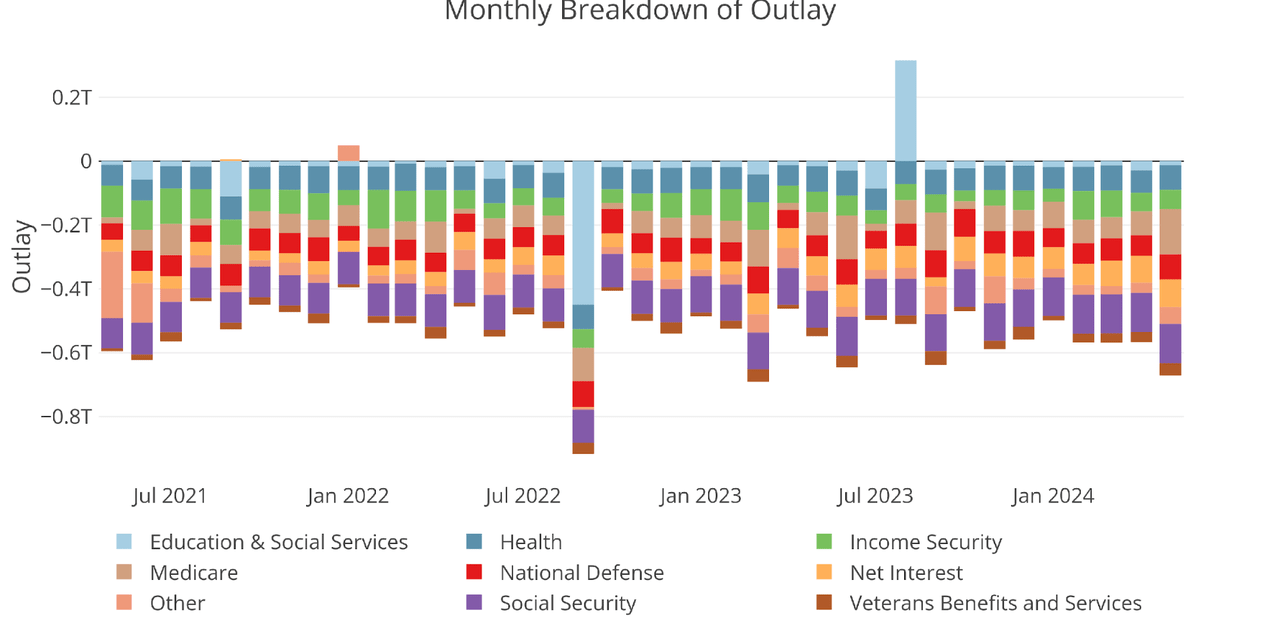
Figure: 7 Monthly Outlays

Interest Expense has ballooned higher to $836B.

Figure: 8 TTM Interest Expense
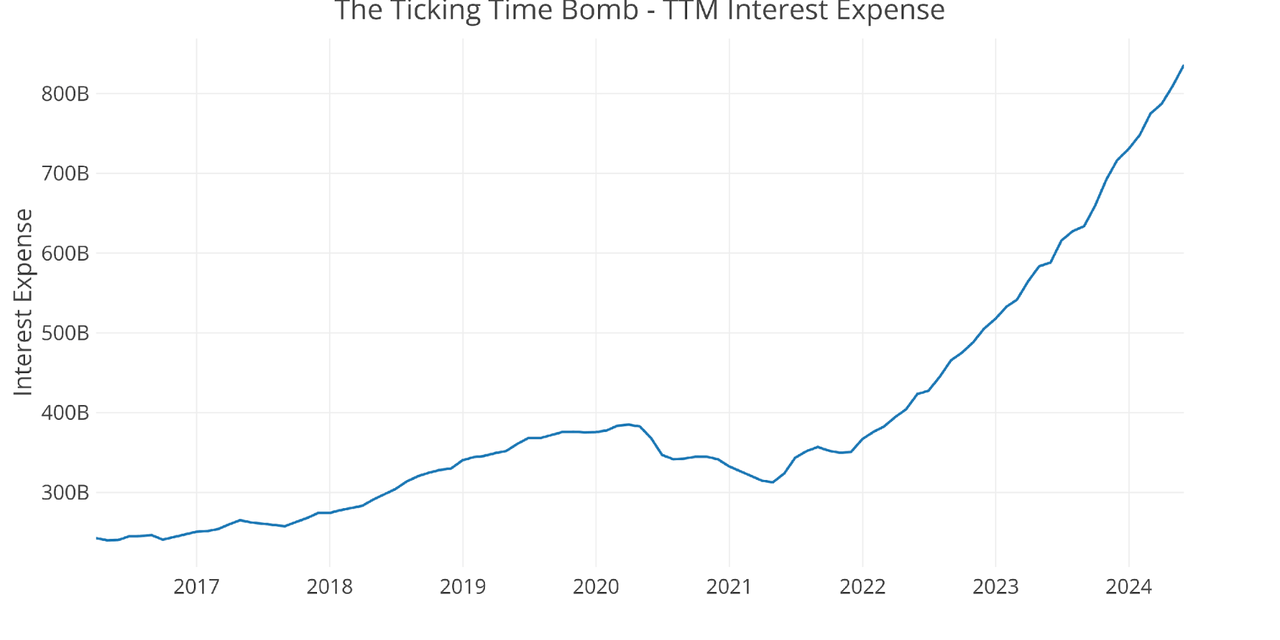
Figure: 8 TTM Interest Expense

The table below goes deeper into the numbers of each category.

Figure: 9 US Budget Detail
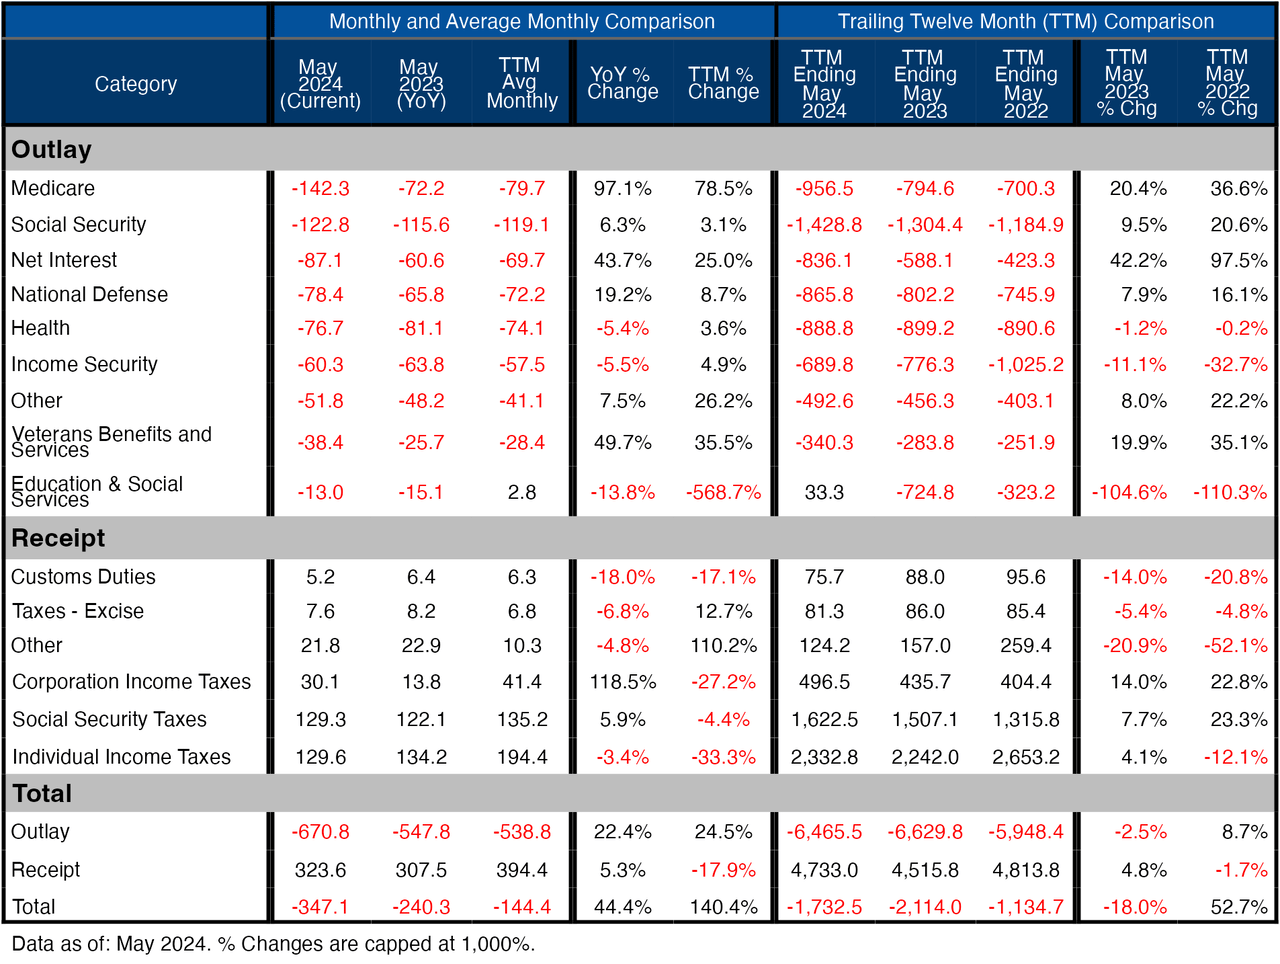
Figure: 9 US Budget Detail

Historical Perspective

Zooming out and looking over the history of the budget back to 1980 shows a complete picture. The change since COVID-19 is quite dramatic.

Figure: 10 Trailing 12-Month (TTM)
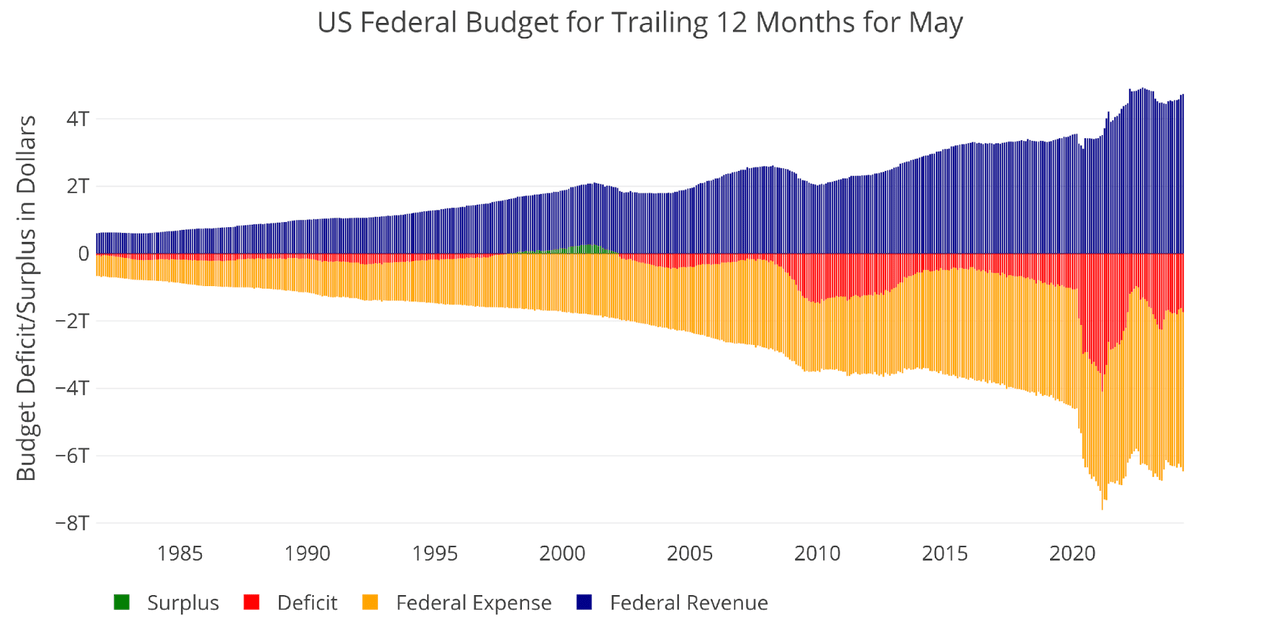
Figure: 10 Trailing 12-Month (TTM)

The next two charts zoom in on the recent periods to show the change when compared to pre-Covid. These charts show spending and revenue on a trailing 12-month basis, period over period.

Figure: 11 Annual Federal Receipts

Figure: 11 Annual Federal Receipts

Figure: 12 Annual Federal Expenses
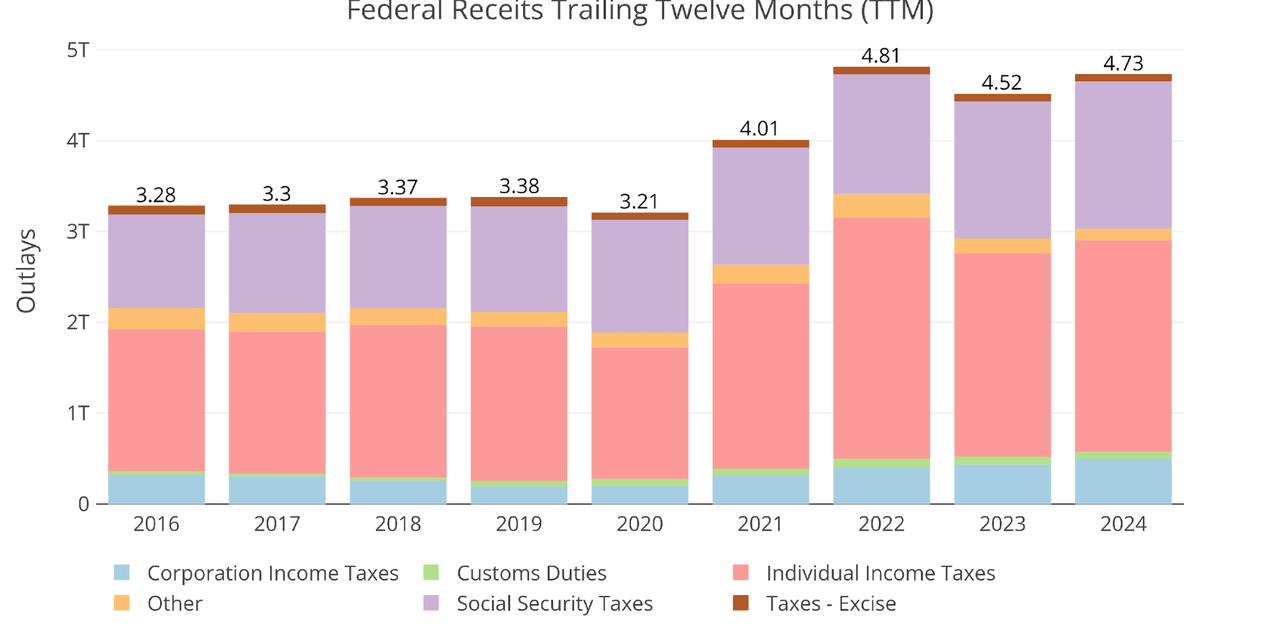
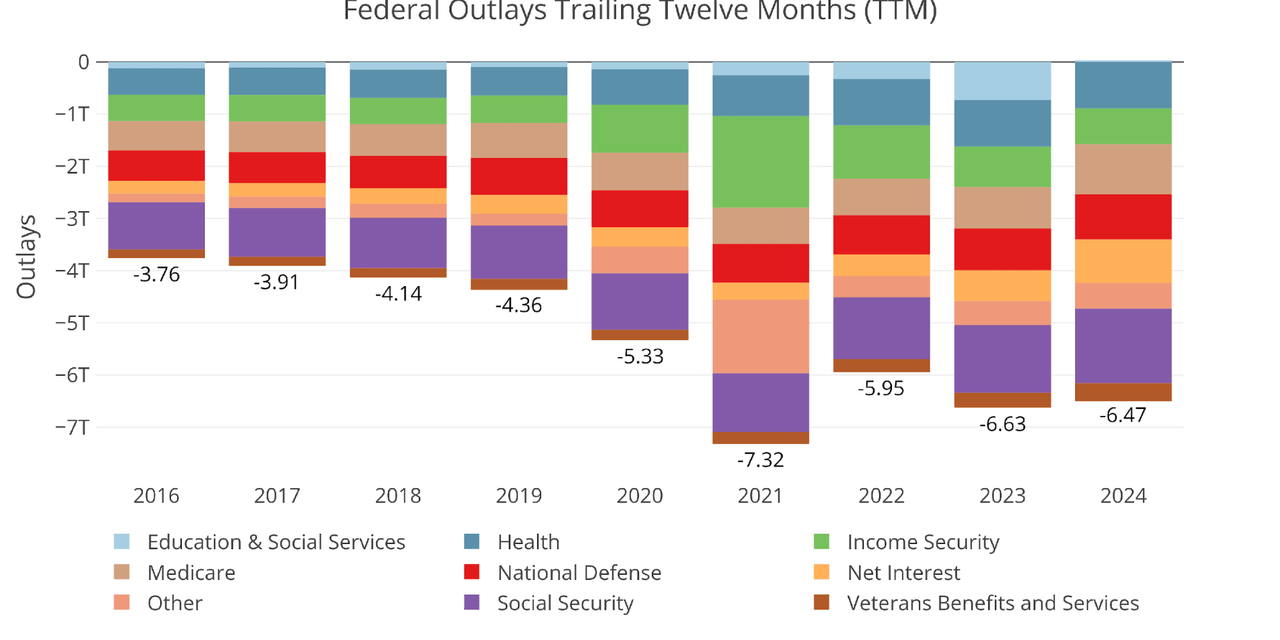
Figure: 12 Annual Federal Expenses

Data Source: Monthly Treasury Statement

Data Updated: Monthly on eighth business day

Last Updated: Period ending May 2024

US Debt interactive charts and graphs can always be found on the Exploring Finance dashboard.

Original Post

Editor’s Note: The summary bullets for this article were chosen by Seeking Alpha editors.

Credit: Source link

ShareTweetSendSharePin

Related Posts

New conspiracy charge filed against Venezuela’s Nicolás Maduro
Market & News

New conspiracy charge filed against Venezuela’s Nicolás Maduro

October 29, 2026
Playwright and star of ‘School Girls’ on bringing their show to Broadway
Market & News

Playwright and star of ‘School Girls’ on bringing their show to Broadway

October 29, 2026
NASA SpaceX Crew-12 splashes down in Pacific
Market & News

NASA SpaceX Crew-12 splashes down in Pacific

October 29, 2026
USS Lincoln sailor will meet his baby boy when ship docks
Market & News

USS Lincoln sailor will meet his baby boy when ship docks

October 29, 2026
Next Post
Stay Tuned NOW with Gadi Schwartz – Dec. 14 | NBC News  NOW

Stay Tuned NOW with Gadi Schwartz - Dec. 14 | NBC News NOW

Leave a Reply Cancel reply

Your email address will not be published. Required fields are marked *

Search

No Result
View All Result
Fugitive on the run for 14 years found living double life as chef

Fugitive on the run for 14 years found living double life as chef

October 29, 2026
Tesla’s Lowered Capex Plan Fuels Doubt on AI, Robotics Goals

Tesla’s Lowered Capex Plan Fuels Doubt on AI, Robotics Goals

October 25, 2026
Six Flags visitors describe aftermath of man falling off ride

Six Flags visitors describe aftermath of man falling off ride

October 27, 2026

About

Learn more

Our Services

Legal

Privacy Policy

Terms of Use

Bloggers

Learn more

Article Links

Contact

Advertise

Ask us anything

©2020- TradePoint.io - All rights reserved!

Tradepoint.io, being just a publishing and technology platform, is not a registered broker-dealer or investment adviser. So we do not provide investment advice. Rather, brokerage services are provided to clients of Tradepoint.io by independent SEC-registered broker-dealers and members of FINRA/SIPC. Every form of investing carries some risk and past performance is not a guarantee of future results. “Tradepoint.io“, “Instant Investing” and “My Trading Tools” are registered trademarks of Apperbuild, LLC.

This website is operated by Apperbuild, LLC. We have no link to any brokerage firm and we do not provide investment advice. Every information and resource we provide is solely for the education of our readers. © 2020 Apperbuild, LLC. All rights reserved.

No Result
View All Result
  • Main
  • AI & Technology
  • Stock Charts
  • Market & News
  • Business
  • Finance Tips
  • Trade Tube
  • Blog
  • Shop

© 2023 - TradePoint.io - All Rights Reserved!