

















• bitcoinBitcoin(BTC)$80,458.003.00%
  • ethereumEthereum(ETH)$2,419.955.25%
  • tetherTether(USDT)$1.000.06%
  • binancecoinBNB(BNB)$712.901.52%
  • rippleXRP(XRP)$1.312.73%
  • usd-coinUSDC(USDC)$1.000.04%
  • solanaSolana(SOL)$95.913.07%
  • tronTRON(TRX)$0.318510-1.00%
  • Figure HelocFigure Heloc(FIGR_HELOC)$1.051.52%
  • zcashZcash(ZEC)$1,318.883.69%
  • HyperliquidHyperliquid(HYPE)$83.39-1.89%
  • dogecoinDogecoin(DOGE)$0.0764292.22%
  • moneroMonero(XMR)$633.67-0.34%
  • USDSUSDS(USDS)$1.000.02%
  • whitebitWhiteBIT Coin(WBT)$77.813.61%
  • chainlinkChainlink(LINK)$11.503.54%
  • leo-tokenLEO Token(LEO)$9.360.61%
  • cardanoCardano(ADA)$0.1973693.51%
  • stellarStellar(XLM)$0.1676502.71%
  • bitcoin-cashBitcoin Cash(BCH)$284.353.16%
  • nearNEAR Protocol(NEAR)$4.010.76%
  • uniswapUniswap(UNI)$7.601.86%
  • daiDai(DAI)$1.000.02%
  • Ethena USDeEthena USDe(USDE)$1.000.06%
  • litecoinLitecoin(LTC)$55.832.51%
  • RainRain(RAIN)$0.005810-6.84%
  • CantonCanton(CC)$0.1028913.69%
  • avalanche-2Avalanche(AVAX)$8.751.96%
  • suiSui(SUI)$0.922.64%
  • USD1USD1(USD1)$1.000.00%
  • the-open-networkGram (prev. Toncoin)(GRAM)$1.16-0.75%
  • tether-goldTether Gold(XAUT)$4,099.932.27%
  • hedera-hashgraphHedera(HBAR)$0.0727233.64%
  • quant-networkQuant(QNT)$205.865.54%
  • Global DollarGlobal Dollar(USDG)$1.000.03%
  • shiba-inuShiba Inu(SHIB)$0.0000051.19%
  • BittensorBittensor(TAO)$234.562.46%
  • paypal-usdPayPal USD(PYUSD)$1.000.02%
  • crypto-com-chainCronos(CRO)$0.0522433.39%
  • Ripple USDRipple USD(RLUSD)$1.000.04%
  • EthenaEthena(ENA)$0.179423-1.53%
  • Ondo US Dollar YieldOndo US Dollar Yield(USDY)$1.15-0.22%
  • okbOKB(OKB)$111.252.68%
  • Circle USYCCircle USYC(USYC)$1.140.01%
  • pepePepe(PEPE)$0.000005-0.52%
  • aaveAave(AAVE)$132.221.58%
  • OndoOndo(ONDO)$0.4065631.39%
  • Pump.funPump.fun(PUMP)$0.004301-2.12%
  • MemeCoreMemeCore(M)$0.84-1.53%
  • BlackRock USD Institutional Digital Liquidity FundBlackRock USD Institutional Digital Liquidity Fund(BUIDL)$1.000.00%
TradePoint.io
  • Main
  • AI & Technology
  • Stock Charts
  • Market & News
  • Business
  • Finance Tips
  • Trade Tube
  • Blog
  • Shop
No Result
View All Result
TradePoint.io
No Result
View All Result

FCOM ETF: Solid Long-Term Growth Outlook, But Volatility Can Be High (NYSEARCA:FCOM)

July 24, 2024
in Market & News
Reading Time: 5 mins read
A A
FCOM ETF: Solid Long-Term Growth Outlook, But Volatility Can Be High (NYSEARCA:FCOM)
ShareShareShareShareShare

Luis Alvarez

ETF Overview

Fidelity MSCI Communication Services ETF (NYSEARCA:FCOM) owns a portfolio of 25 U.S. communication services stocks. The fund has a low expense ratio of 0.08%. Its fund price has almost recovered to the previous peak reached in 2021 and is on a rising trend. The fund has a high concentration risk and the fund’s performance can be impacted heavily by the cyclicality of the economy. FCOM’s long-term growth outlook remains bright. Although its valuation is elevated, it is still well below the peak reached during the pandemic. Given FCOM’s strong long-term growth outlook, the fund deserves a buy-rating.

Fund Analysis

FCOM has walked out of the cyclical low reached in late 2022

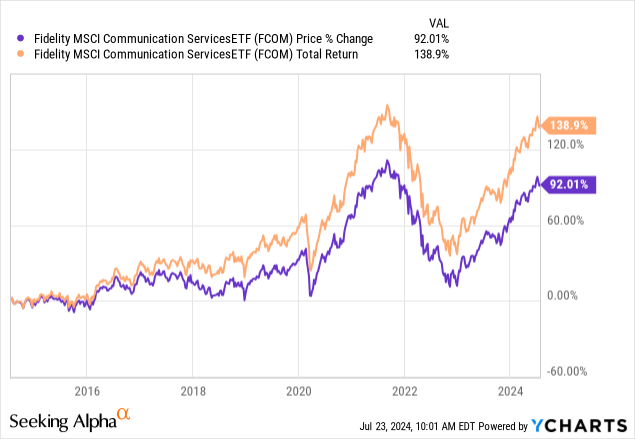
Let us first review how FCOM has performed in the past few years. The fund has done very well during the initial outbreak of the pandemic thanks to the strong demand for communication services. Unfortunately, FCOM experienced a significant decline in much of 2022 due to rising inflation as well as declining demand. Fortunately, FCOM has gradually walked out of the low reached in late 2022 and its fund price has almost fully recovered from the peak reached during the pandemic.

Chart

YCharts

A concentrated portfolio

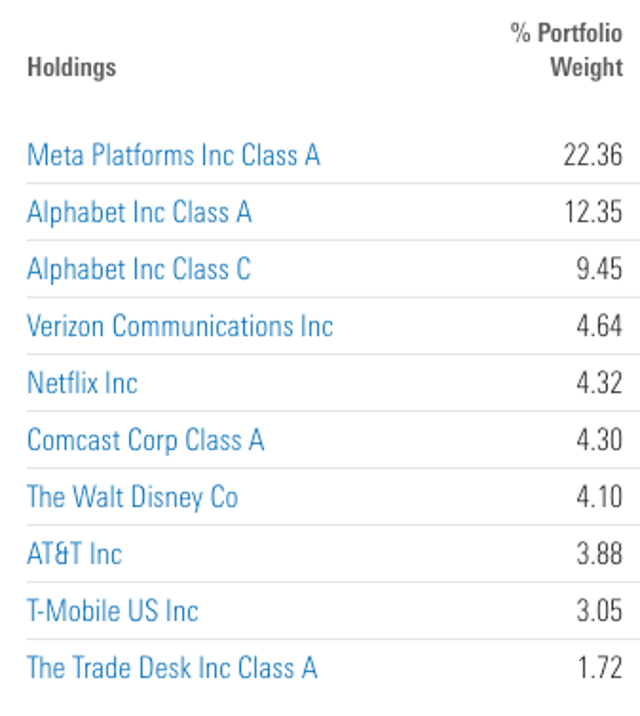
FCOM has a concentrated portfolio. As can be seen from the table below, its two largest holdings, Meta Platforms (META) and Alphabet (GOOGL) consist of about 44.2% of the total portfolio. This high concentration is a concern, especially because the majority of the revenues of these two stocks come from advertising revenues. As we know, advertising incomes can be very cyclical. In economic recessions, businesses typically are less willing to spend on advertising, and vice versa. Therefore, FCOM’s performance can be quite cyclical and volatile.

Holdings

Morningstar

Higher volatility and downside risk

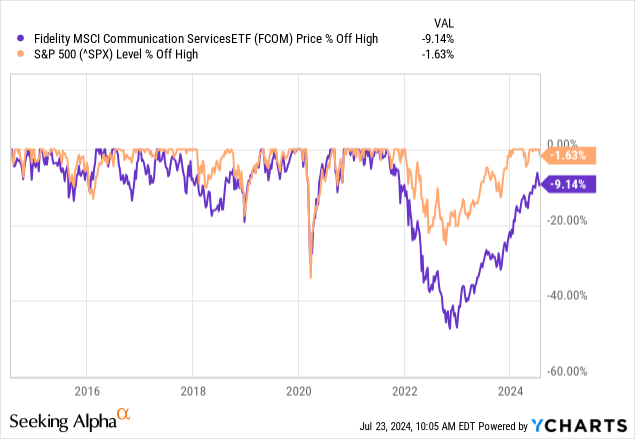
This is exactly the case for FCOM in the past. Its 5-year average monthly beta ratio of 1.13 is much higher than the S&P 500 index’s 1.0. In addition, FCOM also has higher downside risk in economic turmoil due to its higher exposure to stocks that depends on advertising revenue. As can be seen from the chart below, FCOM typically experienced much higher downside than the S&P 500 index in harsh situations. For example, in the rapid rate rising environment in 2022, the fund has declined by more than 45%. In contrast, the S&P 500 index only declined by about 23%.

Chart

YCharts

Growth outperforming many other sectors

FCOM has better short-term and long-term earnings growth rate than the S&P 500 index. Below is a table that shows the short-term earnings growth (STEG) and long-term earnings growth (LTEG) rates of communication services stocks and the S&P 500 index. For reader’s information, STEG refers to next 12 month earnings growth, and LTEG refers to average annual earnings growth rate in each of the next 5 years. As can be seen from the table below, communication services stocks have STEG and LTEG rates of 16.1% and 18.2% respectively. These growth rates are slightly higher than the S&P 500 index’s growth rates. Therefore, we like FCOM’s growth outlook.

Earnings Growth

STEG

LTEG

Communication Services

16.1%

18.2%

S&P 500 Index

13.2%

16.9%

Source: Yardeni Research, Created by author

In addition, the growth rate for communication services stocks in the next two years are expected to be in the double digits. As can be seen from the table below, the sector’s earnings growth rates are expected to be 12.7% and 13.7% in 2025 and 2026 respectively. These rates are comparable to the S&P 500 index’s earnings growth rate of 14.9% in 2025 and 12.5% in 2026.

Earnings Growth

2025

YOU MAY ALSO LIKE

Stock Yards Bancorp, Inc. (SYBT) Presents at 2026 Hovde Group Financial Services Conference – Slideshow

Wembanyama has career night with 52 points, 24 rebounds, 8 blocks in Spurs' win – ESPN

2026

Communication Services

12.7%

13.7%

S&P 500 Index

14.9%

12.5%

Source: Yardeni Research, Created by author

Valuation not cheap

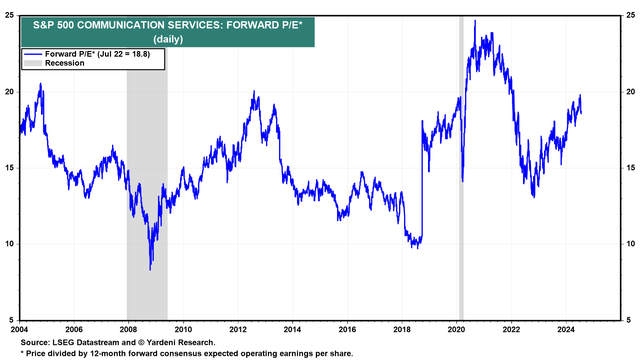
Below is a chart that shows the average forward P/E ratio of communication services stocks in the S&P 500 index. As can be seen from the chart, these stocks currently trade at an average forward P/E ratio of 18.8x. This ratio is below the peak of 23~24x reached during the height of the pandemic in late 2020 and early 2021, but still quite elevated relative to the sector’s valuation range in the past 2 decades.

一張含有 文字, 螢幕擷取畫面, 行, 繪圖 的圖片 自動產生的描述

Yardeni Research

Investor Takeaway

We like FCOM’s growth outlook and its valuation is not particularly expensive. Therefore, we are willing to give it a buy-rating. However, as we have shown in our analysis, investors should embrace for volatility. Conservative investors may want to wait for a pullback.

Additional Disclosure: This is not financial advice and that all financial investments carry risks. Investors are expected to seek financial advice from professionals before making any investment.

Credit: Source link

ShareTweetSendSharePin

Related Posts

Stock Yards Bancorp, Inc. (SYBT) Presents at 2026 Hovde Group Financial Services Conference – Slideshow
Market & News

Stock Yards Bancorp, Inc. (SYBT) Presents at 2026 Hovde Group Financial Services Conference – Slideshow

November 5, 2026
Wembanyama has career night with 52 points, 24 rebounds, 8 blocks in Spurs' win – ESPN
Market & News

Wembanyama has career night with 52 points, 24 rebounds, 8 blocks in Spurs' win – ESPN

November 5, 2026
Pennsylvania reports 6th measles-associated death – The Washington Post
Market & News

Pennsylvania reports 6th measles-associated death – The Washington Post

November 5, 2026
Joby Aviation, Inc. (JOBY) Q3 2026 Earnings Call Transcript
Market & News

Joby Aviation, Inc. (JOBY) Q3 2026 Earnings Call Transcript

November 5, 2026
Next Post
Tesla Stock Live Earning Report…

Tesla Stock Live Earning Report...

Leave a Reply Cancel reply

Your email address will not be published. Required fields are marked *

Search

No Result
View All Result
Dan Ives gives his rapid-fire picks for his ultimate AI portfolio. 📈

Dan Ives gives his rapid-fire picks for his ultimate AI portfolio. 📈

November 4, 2026
Sensient Technologies: The Selloff Doesn't Fix The Valuation

Sensient Technologies: The Selloff Doesn't Fix The Valuation

November 2, 2026
She Resents Her Husbands for His Lack of Financial Input

She Resents Her Husbands for His Lack of Financial Input

October 30, 2026

About

Learn more

Our Services

Legal

Privacy Policy

Terms of Use

Bloggers

Learn more

Article Links

Contact

Advertise

Ask us anything

©2020- TradePoint.io - All rights reserved!

Tradepoint.io, being just a publishing and technology platform, is not a registered broker-dealer or investment adviser. So we do not provide investment advice. Rather, brokerage services are provided to clients of Tradepoint.io by independent SEC-registered broker-dealers and members of FINRA/SIPC. Every form of investing carries some risk and past performance is not a guarantee of future results. “Tradepoint.io“, “Instant Investing” and “My Trading Tools” are registered trademarks of Apperbuild, LLC.

This website is operated by Apperbuild, LLC. We have no link to any brokerage firm and we do not provide investment advice. Every information and resource we provide is solely for the education of our readers. © 2020 Apperbuild, LLC. All rights reserved.

No Result
View All Result
  • Main
  • AI & Technology
  • Stock Charts
  • Market & News
  • Business
  • Finance Tips
  • Trade Tube
  • Blog
  • Shop

© 2023 - TradePoint.io - All Rights Reserved!