

guvendemir
Overview
Exxon Mobil Corporation (NYSE:XOM) and Shell plc (SHEL) are two of the largest oil companies in the world with MV (Market Value) of $414 billion and $204 billion respectively. Exxon is based in Houston and Shell is in London, England.
From an MV point, Exxon is the second largest behind only Saudi Aramco (ARMCO) and Shell is the fourth largest, just ahead of PetroChina (OTCPK:PCCYF).
companiesmarketcap.com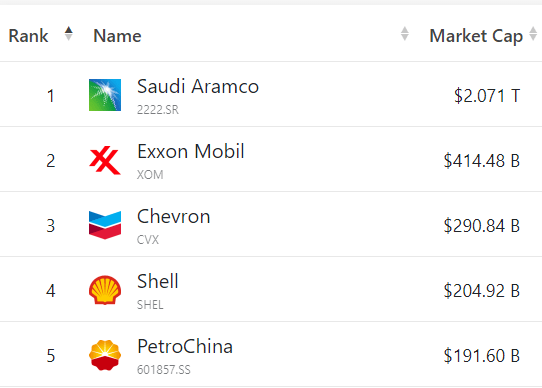
Both companies were hugely successful in 2022 but are now facing lower oil and gas prices in 2023. Note that Exxon’s 2022 revenue of $398 billion is barely higher than Shell’s $381 billion.
Looking at the Total Return (including dividends) over the last year, XOM has done better with an increase of 16% versus Shell’s increase of 7%.
Seeking Alpha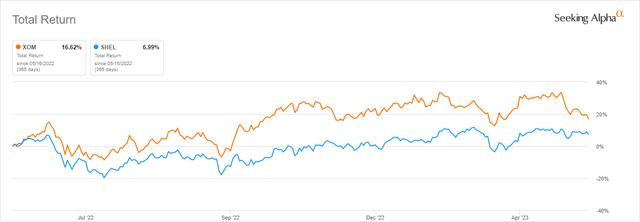
Looking at the maps of operations it is easy to see the magnitude of Exxon’s resources which are literally on every continent.
Exxon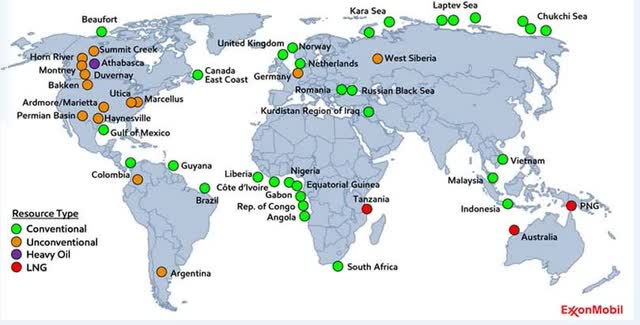
Shell has a similar look, with operations on every continent except Antarctica.
Shell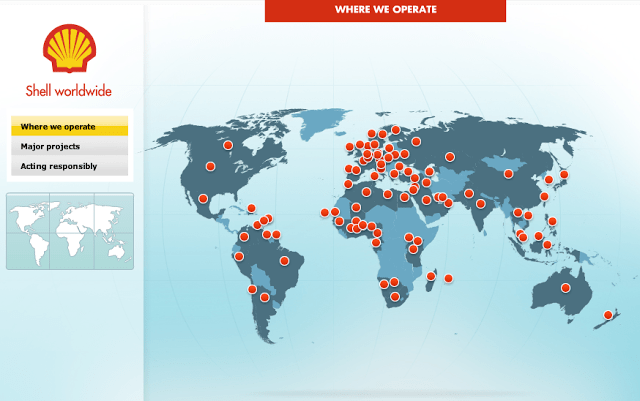
It is no surprise that the biggest differences in the operations map are North America where Exxon dominates and Europe where Shell dominates.
In this article, I will compare both companies to determine which one or both presents the best investment opportunity going forward.
Here are four points to consider before investing in either Exxon or Shell.
1. Financial metrics
As anyone who follows the market knows, oil companies have underperformed the market over the last year. On a 2023 YTD basis, energy is the worst-performing sector, down more than 14% in less than five months. Even after the disaster of Silicon Valley bank and Credit Suisse, Financials look better than Energy.
CSIMarket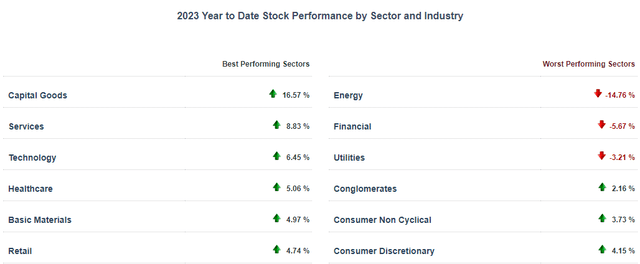
And looking at XOM and SHEL individually, they have performed quite differently over the last 12 months.
Seeking Alpha and author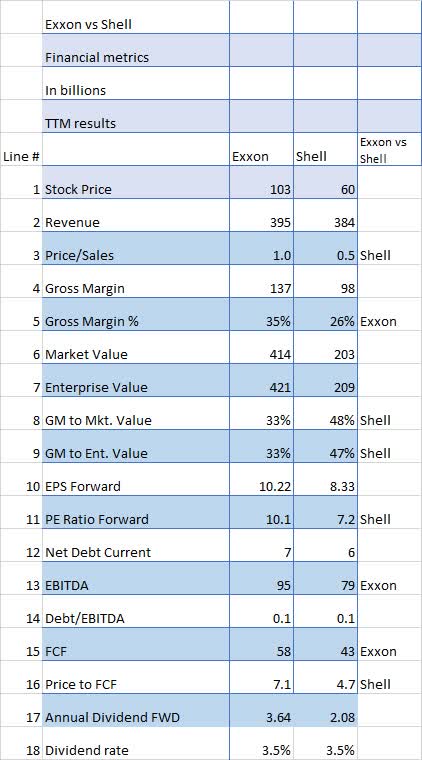
The first item is the Price/Sales ratio (Line 3) where Shell’s ratio is 1/2 of Exxon’s. This could imply that Shell is underpriced compared to Exxon.
But moving on to Gross Margin % (Line 5) which shows XOM with a huge advantage of 35% to 26%. In fact, it was such a large difference I went back and checked it twice. But here’s the comparison going back to 2014.
Seeking Alpha and author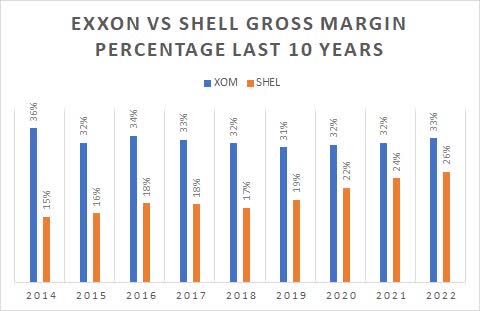
Obviously, Exxon has consistently shown greater GM than Shell. Exxon has never fallen below a 31% margin and Shell has never been higher than 2022’s 26%.
This difference may be related to more stringent regulations in Europe, Shell’s concentration on ESG initiatives, or the fact that a larger proportion of Shell’s revenue is from natural gas. Whatever the reasons, the long-term difference in gross margins is very obvious in the above chart.
Other financial metrics of interest include the PE Ratio (Line 11) which shows a small advantage to Shell.
When it comes to EBITDA (Line13) Exxon shows a huge advantage of $16 billion. Ditto for FCF (Line 15) where Exxon outperforms again by $15 billion.
And finally, in terms of dividend rate, both are right around 2.5%.
Advantage: Exxon
2. What do analysts think?
Looking at how Wall Street analysts have rated the two shows Shell with a slight advantage with no Sell recommendations compared to Exxon’s six Sells including one Strong Sell. Exxon, on the other hand, looks pretty good despite the six Sell recommendations. It has more buy ratings at 19 compared to 16 Buys for Shell. Exxon also has nine Strong Buys, a very high percentage.
Seeking Alpha and author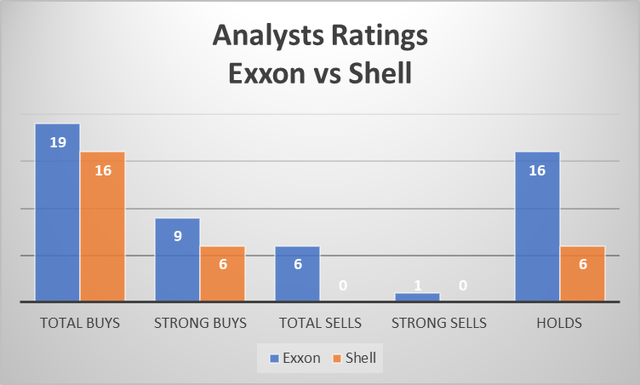
When it comes to the quants, they currently have both Exxon and Shell as a hold. But over the last year, Exxon had quite a few Strong Buys versus a 100% Hold for Shell.
Seeking Alpha Seeking Alpha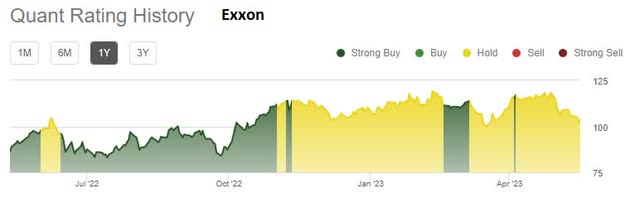
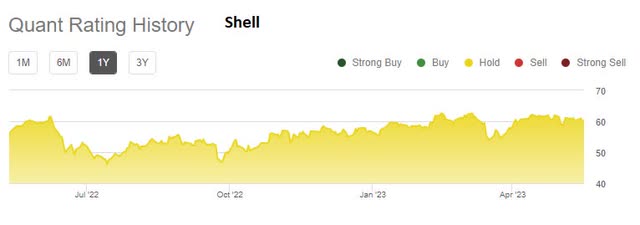
For some reason, the quant algorithms have been unable to find a reason to buy Shell.
Advantage: Neither
3. Share buybacks are a priority for both companies
With their enormous financial capabilities, both companies have announced policies to return excess cash flow back to the shareholders.
Exxon has upped its share buyback to $50 billion over three years, representing about 12% of Exxon shares.
Shell recently announced a $4 billion buyback, which sounds paltry compared to Exxon’s $50 billion and only represents about 2% of their shares.
Advantage: Exxon
4. Dividend increases are coming for both Exxon and Shell
Exxon has increased its dividend every year for 20 years, but the last five years have been relatively meager with an average annual increase of less than 4% going from $0.77 per quarter to $0.91 per quarter.
Seeking Alpha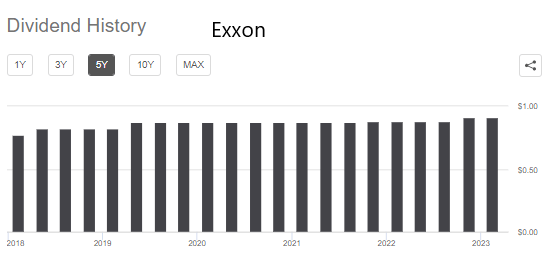
Shell simplified their share structure in January 2022, and therefore, only has a short dividend history.
Seeking Alpha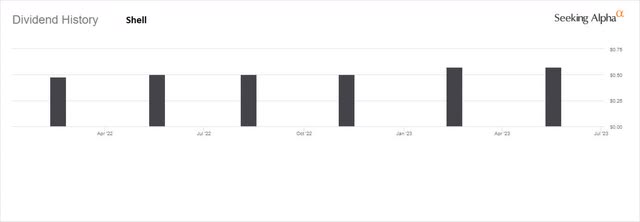
Advantage: Exxon
Conclusion:
Comparing Exxon to Shell shows significant differences, especially in the area of financial metrics.
Exxon shows vastly superior margins, EBITDA, and FCF compared to Shell. Also, they have a huge difference in share buyback allocations.
On the other hand, Shell could be considered somewhat underpriced looking at market value and PE. But I think Shell is lower priced for a reason, and that is per the numbers quoted above.
Exxon is a Buy due to its superior financial metrics and its commitment to cutting costs and decreasing share count.
Shell is a Hold.
Credit: Source link