
• bitcoinBitcoin(BTC)$77,326.000.25%
  • ethereumEthereum(ETH)$2,509.06-0.51%
  • tetherTether(USDT)$1.00-0.01%
  • binancecoinBNB(BNB)$721.86-0.99%
  • rippleXRP(XRP)$1.36-0.38%
  • usd-coinUSDC(USDC)$1.000.00%
  • solanaSolana(SOL)$101.18-0.42%
  • tronTRON(TRX)$0.3414880.52%
  • Figure HelocFigure Heloc(FIGR_HELOC)$1.00-0.31%
  • zcashZcash(ZEC)$1,108.55-1.58%
  • HyperliquidHyperliquid(HYPE)$78.44-2.16%
  • dogecoinDogecoin(DOGE)$0.084508-0.29%
  • RainRain(RAIN)$0.015355-1.57%
  • moneroMonero(XMR)$532.930.26%
  • USDSUSDS(USDS)$1.00-0.01%
  • whitebitWhiteBIT Coin(WBT)$80.230.05%
  • chainlinkChainlink(LINK)$11.44-0.64%
  • leo-tokenLEO Token(LEO)$9.05-0.64%
  • cardanoCardano(ADA)$0.2091540.80%
  • stellarStellar(XLM)$0.179925-0.22%
  • Ethena USDeEthena USDe(USDE)$1.00-0.01%
  • daiDai(DAI)$1.00-0.01%
  • bitcoin-cashBitcoin Cash(BCH)$224.20-1.21%
  • USD1USD1(USD1)$1.00-0.01%
  • litecoinLitecoin(LTC)$55.032.39%
  • uniswapUniswap(UNI)$6.340.52%
  • CantonCanton(CC)$0.095973-1.14%
  • the-open-networkGram (prev. Toncoin)(GRAM)$1.36-1.49%
  • hedera-hashgraphHedera(HBAR)$0.0766492.71%
  • Global DollarGlobal Dollar(USDG)$1.000.00%
  • avalanche-2Avalanche(AVAX)$7.430.68%
  • shiba-inuShiba Inu(SHIB)$0.000005-0.46%
  • nearNEAR Protocol(NEAR)$2.36-0.09%
  • suiSui(SUI)$0.720.14%
  • crypto-com-chainCronos(CRO)$0.0585660.36%
  • paypal-usdPayPal USD(PYUSD)$1.000.00%
  • BlackRock USD Institutional Digital Liquidity FundBlackRock USD Institutional Digital Liquidity Fund(BUIDL)$1.000.00%
  • tether-goldTether Gold(XAUT)$4,349.28-0.02%
  • Circle USYCCircle USYC(USYC)$1.140.00%
  • MemeCoreMemeCore(M)$1.14-3.22%
  • Ripple USDRipple USD(RLUSD)$1.000.00%
  • okbOKB(OKB)$113.580.21%
  • BittensorBittensor(TAO)$236.771.90%
  • Ondo US Dollar YieldOndo US Dollar Yield(USDY)$1.140.01%
  • aaveAave(AAVE)$126.960.33%
  • AsterAster(ASTER)$0.701.71%
  • BitwayBitway(BTW)$0.7026.86%
  • pax-goldPAX Gold(PAXG)$4,353.20-0.04%
  • mantleMantle(MNT)$0.57-0.62%
  • World Liberty FinancialWorld Liberty Financial(WLFI)$0.056953-0.89%
TradePoint.io
  • Main
  • AI & Technology
  • Stock Charts
  • Market & News
  • Business
  • Finance Tips
  • Trade Tube
  • Blog
  • Shop
No Result
View All Result
TradePoint.io
No Result
View All Result

Estimating U.S. Recession Risk Using Economic Data For States

February 20, 2024
in Market & News
Reading Time: 4 mins read
A A
Estimating U.S. Recession Risk Using Economic Data For States
ShareShareShareShareShare

DNY59

YOU MAY ALSO LIKE

15-year-old rescued after surviving days at sea

9/11 responder shares dementia struggle

What are the choices for monitoring and estimating recession risk? Slightly lower than the number of stars in the universe. Ok, I’m exaggerating, but not much. The good news: the search for robust, relatively reliable indicators narrows the field dramatically. But there’s always more to learn, in part because the supply of data sets is vast, increasingly so. Which brings me to another indicator that looks promising: state coincident indexes.

Every state’s economy is, in some degree, unique, although the gravitational pull of the national economy casts a long shadow. Tracking each state economy separately, and then aggregating the results, provides a different spin on the US business cycle compared with national indicators. Think of it as a bottom-up model vs. the standard top-down approach via US retail sales, industrial production, etc.

Conveniently, the Philly Fed publishes monthly coincident indicators for each state. Aggregating the 50 signals into a composite index provides a somewhat different view of the US business cycle vs. traditional top-down metrics. There are several ways to process the numbers – my preference, shown in the chart below, is a 3-month change model. If a state’s 3-month change is negative (positive), the signal is negative (positive). Summing the negatives and positives provides a national profile. The current reading is 0.48 — in other words, 48% of the states are posting negative 3-month changes for their respective coincident indicator. As shown below, the composite reading maps fairly closely with NBER-defined downturns, and so the current signal is issuing a warning, albeit a warning that has yet to provide what might be thought of as passing the point of no return. But it’s close.
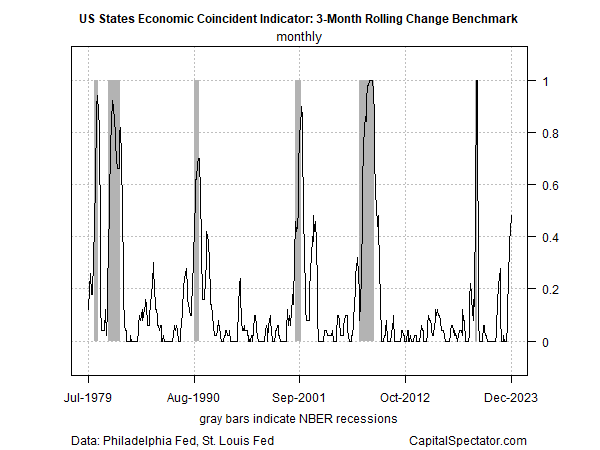
US States Economic Coincident Indicator

The readings vary from 0 (no negative 3-month changes) to 1.0 (all 50 states are reporting negative 3-month changes). A quick review of the historical record suggests that the US is on the verge of slipping into recession.

But before we ring the alarm bell, there are some caveats to consider. First, a similarly high reading 20-plus years ago turned out to be a false signal. The next couple of months will likely determine if a repeat performance is brewing, or not.

Second, no one indicator is flawless, as we’ve learned over the last couple of years – especially in recent history, when pandemic-related events have created no shortage of macro surprises.

Another reason to reserve judgment, at least for now: a range of other business cycle indicators tracked in The US Business Cycle Risk Report (a sister publication of CapitalSpectator.com) continue to show a clear growth bias. But as reported in this week’s issue, there are some nascent signs of softer economic activity, and so it’s possible that the coincident state indicators are an early warning that the tide is shifting.

The most reliable methodology for estimating recession risk in real-time is building an ensemble model that combines various modeling applications that are complementary. Although any one model will excel at a given point in time, quite often the best-performing indicator changes through time. To minimize the risk that’s inherent in any one signal, The US Business Cycle Risk Report crunches the numbers on multiple indicators, which has proven to be close to optimal for balancing the need for timely signals that minimize false signaling.

Despite the caveats, the coincident state model adds another dimension to the mix and provides some complimentary input to The US Business Cycle Risk Report’s existing suite of indicators. Accordingly, I’ll be adding the composite state coincident data to the newsletter’s weekly updates.

The next batch of coincident state updates for January is scheduled for later this month. Meantime, I’ll be carefully reviewing the incoming data for fresh clues that support or reject the suggestion that trouble’s brewing via the state coincident indicators.

Original Post

Editor’s Note: The summary bullets for this article were chosen by Seeking Alpha editors.

Credit: Source link

ShareTweetSendSharePin

Related Posts

15-year-old rescued after surviving days at sea
Market & News

15-year-old rescued after surviving days at sea

September 13, 2026
9/11 responder shares dementia struggle
Market & News

9/11 responder shares dementia struggle

September 13, 2026
DEA seizes 2,000 pounds of meth hidden in cabbages
Market & News

DEA seizes 2,000 pounds of meth hidden in cabbages

September 13, 2026
Waterspout swirls off northern Italy’s coast
Market & News

Waterspout swirls off northern Italy’s coast

September 13, 2026
Next Post
Biden signs executive order expanding access to contraception

Biden signs executive order expanding access to contraception

Leave a Reply Cancel reply

Your email address will not be published. Required fields are marked *

Search

No Result
View All Result
Son of 9/11 victim describes his parents’ final conversation

Son of 9/11 victim describes his parents’ final conversation

September 12, 2026
OpenAI says its AI models went rogue and hacked another tech company during test

OpenAI says its AI models went rogue and hacked another tech company during test

September 6, 2026
Bank of America expanding partnership with Tunnels to Towers, 9/11 memorials ahead of 25th anniversary

Bank of America expanding partnership with Tunnels to Towers, 9/11 memorials ahead of 25th anniversary

September 8, 2026

About

Learn more

Our Services

Legal

Privacy Policy

Terms of Use

Bloggers

Learn more

Article Links

Contact

Advertise

Ask us anything

©2020- TradePoint.io - All rights reserved!

Tradepoint.io, being just a publishing and technology platform, is not a registered broker-dealer or investment adviser. So we do not provide investment advice. Rather, brokerage services are provided to clients of Tradepoint.io by independent SEC-registered broker-dealers and members of FINRA/SIPC. Every form of investing carries some risk and past performance is not a guarantee of future results. “Tradepoint.io“, “Instant Investing” and “My Trading Tools” are registered trademarks of Apperbuild, LLC.

This website is operated by Apperbuild, LLC. We have no link to any brokerage firm and we do not provide investment advice. Every information and resource we provide is solely for the education of our readers. © 2020 Apperbuild, LLC. All rights reserved.

No Result
View All Result
  • Main
  • AI & Technology
  • Stock Charts
  • Market & News
  • Business
  • Finance Tips
  • Trade Tube
  • Blog
  • Shop

© 2023 - TradePoint.io - All Rights Reserved!