
Trygve Finkelsen
Overview
My recommendation for ESAB Corporation (NYSE:ESAB) is a buy rating, as I believe it is able to grow EPS at a mid-teens CAGR through FY28, in line with management guidance. This belief is supported by the ongoing tailwinds at ESAB end markets and the on-track internal initiatives that should start to show their impact in the financials soon. Note that I previously gave a buy rating for ESAB because I believed the business had exposure to multiple end-markets that were experiencing positive trends. As ESAB shows continuous organic growth and margin improvements, its valuation should improve.
Recent results & updates
The stock has performed really well since my coverage in March this year, returning almost 30% at the current share price of (~$86). ESAB’s recent 3Q23 quarter remains very strong, with net sales increasing 12% to $644 million (ex-Russian impact). By segment, Americas revenue was up 9%, while EMEA and APAC were up 14%. Profitability was in the spotlight as EBITDA reached a record high in the quarter. EBITDA margin increased by 170bps on an annual basis to 18.3%, with the absolute EBITDA coming in at $118 million. As a result, adj. EPS came in at $1.08, beating the consensus estimate of $0.96.
With the strong performance, management refreshed their long-term outlook during Investor Day, which I found to be very positive. For those who missed the presentation, management is now guiding high-teen EPS CAGR potential through FY28. Specifically, management’s 2028 targets point to low-double-digit percentage organic EPS growth with the potential to reach high-teen percentage growth with the aid of acquisitions. Breaking down the growth contribution between revenue and profits, revenue is expected to grow at 9% CAGR, and EBITDA margin is expected to hit >22%. Combination of both would lead to 10% EPS growth; topping that with acquisitions leads to high-teen EPS growth potential. As such, there are two key debates here: whether ESAB can grow organically and if they have the capacity to acquire.
Starting with the first debate. I believe ESAB can continue to grow as the near-term trends remain strong. In terms of volume, while volume was down in the Americas by 3%, if we adjust for the PLS impact, volume was actually up across all regions (Americas would be up by low single-digits). Volume was particularly resilient in Europe, the Middle East, and India, as management noted. Specifically, volume growth remains strong due to reshoring trends in the United States, Canada, and Mexico and strong levels of infrastructure investment in India and the Middle East. Growth tailwinds in ESAB’s end markets remain strong, and there appear to be no signs of a slowdown. For instance, renewable energy investments in Europe, the Middle East, the US, and South America continue to be a long-term tailwind, and the same dynamic can be seen in the agriculture and downstream O&G investment end-markets.
As for the automation and equipment business, sales also remain strong. Management has also called out their market share gains with their new products like Volt, Warrior Edge, and Cobot, which are sold to both existing and new customers. From a percentage performance basis, recent performance also suggests that management long-term guidance of 9% CAGR can be easily achieved. The business saw low-double-digit percentage volume growth, which outpaced consumable growth, while Cobot sales even grew triple-digits vs. last year. The percentage of revenue attributable to equipment mix increased from 26% in 2016—the year before ESAB’s decision to reinvigorate its equipment portfolio—to 31% in 3Q23. As such, continuous strong growth here has a high contribution to ESAB on a consolidated basis. Notably, equipment gross margins are higher than consumables; as such, the higher equipment growth has a positive mix shift impact on margins (in line with management guidance). Looking ahead, ESAB appears to be on track to reach its target mix of 35% equipment, which should continue to contribute to margin expansion.
Touching more on margin expansion, it is not only supported by top-line growth. ESAB internal initiatives should also yield positive results. The Denton, TX, facility was one of several that completed Kaizens in the third quarter as EBX (ESAB Business Excellence) ramped up its efforts. There is a current push to consolidate manufacturing, mainly in Europe, and I expect that this will begin to pay off in the next few quarters. In general, ESAB’s plan to reduce its footprint is still on track, and I anticipate further encouraging news in the near future. Elsewhere, the PLS initiative should be pretty much done by 4Q in America. The majority of the work on rightsizing SKUs in the Americas and addressing the associated volume drag will be completed by 4Q23. This means that the near-term headwinds will be over, and we should see a positive impact on financials starting in 1Q24
Lastly, in terms of acquisitions, management plans is to use 85% of excess capital for M&A and 15% for dividends. The leverage target is to keep the net leverage ratio at 2x over the long term, and any capital that doesn’t go toward acquisitions will go toward paying down the debt. I believe these are fair goals, and given ESAB’s present net debt to EBTIDA ratio of around 2x, there is ample opportunity to increase leverage in the event of favorable deals. The fact that ESAB is able to pay down debt is significant because the company is EBITDA and FCF positive. Importantly, M&A deals must meet management’s standards, which include a gross margin of 40% or higher and a ROI of 10% or higher over three to five years. What this means is that all M&A are going to be margin accretive to the business as ESAB current gross margin is only 36%.
Valuation and risk
Author’s valuation model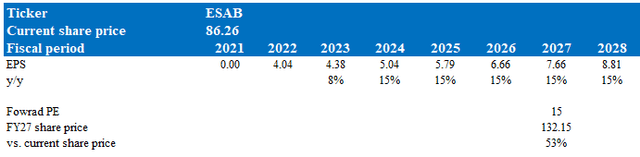
According to my model, ESAB is valued at $132 in FY27, representing a 53% increase over 4 years (or 10+% a year). This target price is based on the management’s long-term EPS CAGR outlook. Management has guided for a possible high-teens EPS CAGR, but I am using a lower assumption as 9% of the high-teens outlook is from M&As that might not occur. One thing to note for my FY23 estimate is that I used consensus estimates. At a 15% CAGR, ESAB should generate around $8.80 of EPS by 2028. I used a 15x forward PE multiple for ESAB instead of the current 18x, as the relative multiple against peers seems too high. I believe ESAB should trade closer to Kennametal Inc. (KMT), as it has higher expected growth and margins than KMT. ESAB should trade at a discount to Lincoln Electric because of its lower margins and higher debt profile (LECO has 1x net debt to EBITDA and a 19% EBIT margin vs. ESAB, which has ~2x net debt to EBTIDA and a 15% EBIT margin).
Bloomberg
Risk
The European market, which accounts for around 30% of ESAB˟s sales could experience a major recession in the next few quarters, which could have a heavier impact on ESAB than I had anticipated. Although I am still bullish on a number of ESAB’s end markets, this does leave the company vulnerable to a wider range of challenges, some of which may be difficult for public investors to assess.
Summary
I reiterate my buy rating for ESAB. Management’s revised outlook during Investor Day, aiming for a high-teen EPS CAGR through FY28, indicates strong growth potential primarily driven by organic growth and possible acquisitions. The tailwinds at ESAB’s end-market are not showing any signs of slowing down, which is very positive and supportive of management’s growth outlook. Moreover, strategic initiatives like facility consolidations and the nearing completion of PLS should help drive margin expansion, supporting EPS growth.
Credit: Source link