

metamorworks/iStock via Getty Images
I’m utterly blown away by the naivety of investors in equity CEFs. The Gabelli Multimedia fund (NYSE:GGT), $6.78 current market price, is without a doubt, and in my opinion, potentially the worst risk/reward in technology funds today.
And yet clearly, there are market forces at work that are keeping GGT’s market price elevated at a ridiculous 77% premium over its liquidation value $3.83 NAV.
That could mean quarter-end window dressing, short covering, legacy shareholders who don’t sell and even reinvest their distributions (double idiocy for that one), or maybe there’s an expectation of a rights offering to help pad the NAV.
I don’t know, but there’s no justification for why GGT should get to trade at a premium at all when the fund has had very underwhelming NAV performance for a technology and multimedia stock based fund.
One would think with a 40% leveraged portfolio of mostly global large-cap technology and multimedia stocks that GGT’s growth potential would be something close to the Nasdaq-100 (QQQ), $362.54 current market price, which is up 36.5% YTD.
But clearly, that has not been the case. In fact, GGT’s NAV is up only 9.8% YTD now, one of the worst of all of the technology-focused CEFs I follow. And if you took out GGT’s two $0.22/share distributions so far this year, GGT’s NAV would actually be negative on the year.
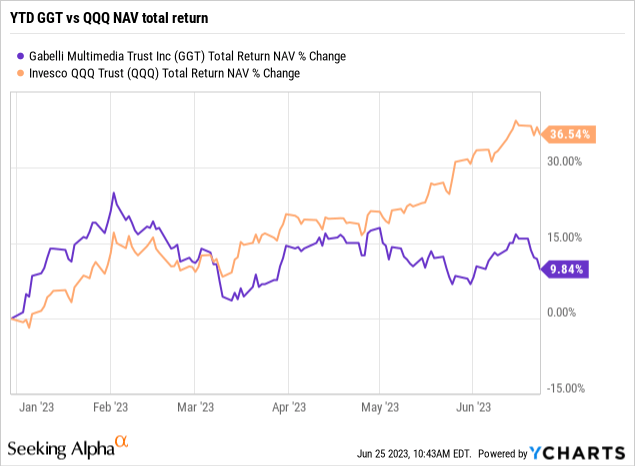
I mean, if you’re going to run up a CEF to a 77% market price premium, it better have the goods to be able to significantly outperform in an up market.
But GGT uses what’s called the MSCI AC World Communication Services Index as its benchmark, an index that doesn’t have a symbol unless you have a Bloomberg terminal.
But over the years, this index has more or less matched the up and down years with the Nasdaq-100 even if it has under-performed the Nasdaq-100 just about every year (see annual performances below):
So the question is, why should a fund like GGT have the highest market price premium for a technology fund in history when it can’t even come close to delivering an NAV performance to cover it? And I sincerely doubt that’s going to change.
In fact, what’s happened over the years is that GGT’s NAV has dropped to a near all-time low. This is from GAMCO and shows GGT’s NAV erosion as GGT’s NAV goes from as high as $21.47 in March of 2000 to $3.83 today:
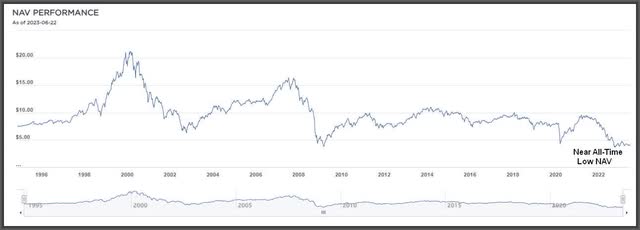
GAMCO
Why has this happened? Because GAMCO has been overpaying GGT’s distribution for years and has pretty much abandoned GGT’s 10% NAV distribution policy in recent years, so it seems. And if you can’t cover your fund’s distributions, then the fund’s NAV erodes.
Not only that, but it also can result in a spiral down of NAV value because each distribution that cannot be covered by portfolio appreciation and/or interest/dividends, only means there’s that much less equity in the fund to derive the next distribution.
If you can’t see how this can accelerate the fund’s NAV erosion, then nothing I tell you will make any difference. Besides all you have to do is look at the graph above to see that is exactly what is happening.
I have no idea why GAMCO is so loathe to cut GGT’s distribution when it has a 10% NAV Distribution Policy. For example, in 2022, GGT should have had no distribution in the fourth quarter and in fact had already overpaid its annual 10% NAV distribution by the third quarter distribution.
No matter, GAMCO kept GGT’s distribution at $0.22/share per quarter despite an NAV that dropped from $8.25 at the beginning of 2022 to $3.89 by the end of 2022.
That was the worst absolute NAV drop by any CEF that year, down -52.9%. Any other CEF would be trading at a wide discount, but for some reason, GGT gets a hall pass.
If GGT Can Trade At 77% Premium, What should Better Performing Tech CEFs Trade At?
There are plenty of better priced alternatives to GGT but the one that stands out to me is the one that trades at the widest discount, putting the valuation difference into the stratosphere.
The Neuberger & Berman Next Generation Connectivity fund (NYSE:NBXG), $10.46 current market price, trades at a current -18.9% discount, due primarily to it being a relatively new fund, having gone public in May of 2021.
As a result, the fund suffered through the bear market of 2022 and obviously had many more sellers that year as original shareholders took their losses, sending the fund to a -22% discount by the end of December of 2022.
Of course, NBXG is a tech focused stock fund so it’s going to have a volatile NAV and MKT price. And in 2022, NBXG lost -36% of its NAV. But that was still better than GGT’s -42.2% NAV loss in 2022 and NBXG owns mostly small to mid-cap technology stocks and even private equity, which got hit much harder than larger-cap tech names in 2022.
And this year, NBXG’s NAV is blowing away GGT’s such that if you back up one-year to June 24, 2022, it’s not even close which fund is outperforming the other at NAV:
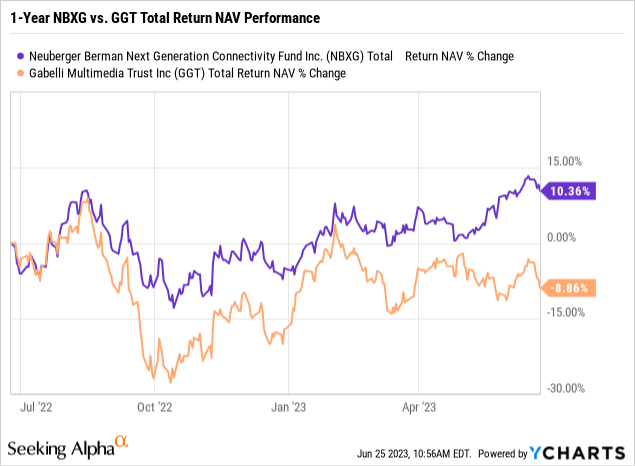
Why has NBXG’s NAV held up so much better than GGT’s NAV? One, NBXG has a much more reasonable 9.3% NAV yield that it has already covered this year with its NAV up 16.0% YTD.
Thus, it’s seeing NAV growth and the more NAV growth you have, the more fund capital you have to derive, and hopefully cover, the next distribution. It won’t happen every month but the bottom line is that NBXG is in a MUCH better position to cover its distribution and grow its NAV than GGT.
The other reason why NBXG’s NAV has held up better than GGT’s, particularly in 2022, is that the fund uses an option-income strategy, which is a defensive strategy that brings in income by writing options against its stock portfolio positions.
GGT, on the other hand, uses a leveraged income strategy, which relies more on appreciation rather than income in a bull market. But in a bear market, a leveraged strategy will only accelerate the downside since leverage works against you in a depreciating market.
Why has GAMCO allowed GGT to disregard its 10% NAV distribution policy and let it run all the way up to a current 23% NAV yield currently? Based on GGT’s NAV at the end of the second quarter this year, which was $3.98, GGT’s distribution should have been more like $0.10/share, not $0.22/share.
So unless GAMCO is looking at GGT as more of an annuity now, allowing it to eventually distribute out all of its capital, then why hasn’t there been a distribution cut by now? And if GAMCO’s board of directors ever does go back to GGT’s 10% NAV distribution policy, shareholders are looking at a -55% distribution cut, based on the current NAV of $3.98.
Tell me, who is willing to take that kind of risk?
I mean the advantages of owning NBXG right now over GGT are so off the charts, you wonder why there’s not an immediate reallocation going on right now.
Because with a nearly 100% valuation difference, a current buyer of NBXG can receive a windfall 11.6% over the funds 9.3% NAV yield whereas a current buyer of GGT gets a not-much-different market yield of 12.9%, but WAY below what GGT pays out with a 23.0% NAV yield. Oh, and NBXG pays monthly whereas GGT pays quarterly.
This is one of the most egregious valuation discrepancies I have ever seen. Of course, any technology-focused CEF would seem cheap compared to GGT at a 77% MKT price premium.
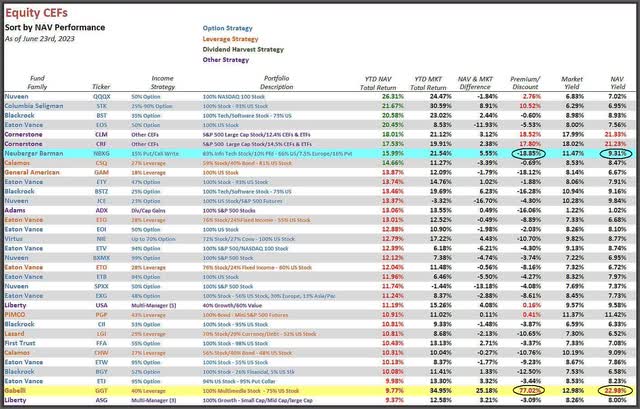
Here’s a look at the top equity CEFs sorted by NAV total return performances this year:
Capital Income Management, LLC
NBXG is highlighted with a light blue background above and you can see where NBXG’s NAV is up 15.99% YTD. That’s 7th best of all the equity CEFs I follow despite trading at a -18.85% discount.
Note: Funds shown in green in the NAV return column are beating the S&P 500 (SPY), $433.21 current market price, which is up 14.1% YTD
Honestly, I could have picked any of the funds above NBXG in my Equity CEF Performance screenshot above, including the Cornerstone Strategic Value fund (CLM), $8.19 current market price, the Cornerstone Total Return fund (CRF), $7.81 current market price, or the popular Columbia Seligman Premium Technology Growth fund (STK), $29.41 current market price, all of which are way more attractive than GGT, despite trading at double-digit premiums.
On the other hand, GGT shown in the highlighted yellow background, isn’t even close to outperforming the S&P 500 anymore, let alone the nasdaq-100. And yet its market price is up a leading 34.95% YTD (column to immediate right).
Why has this happened and how could this have happened when there are so many obvious alternatives with dramatically better valuations and NAV performances?
I can only guess that since GGT went public in 1994, if there are any big legacy shareholders left, they may not be able to sell at the current price when they take into account all of the return of capital they have accumulated, which lowers their cost basis.
Second, second quarter window dressing is here and maybe momentum investors along with short-covering may be giving GGT a boost. And finally, there are probably plenty of clue-less small investors who see the name “Gabelli,” see “Multimedia” and then see a current 13% MKT yield and say, sign me up!
I mean, this is what GGT did last week in a down market:
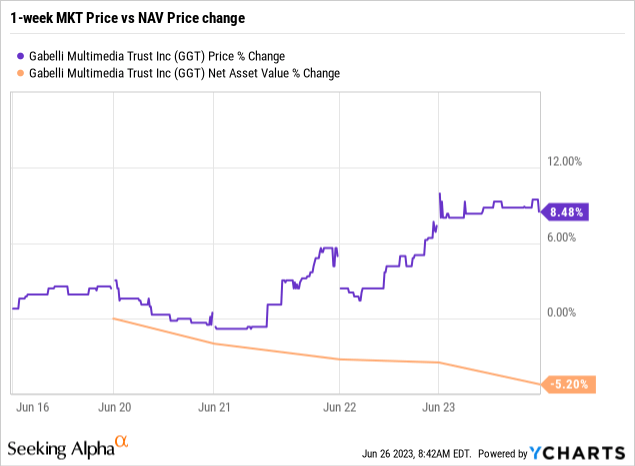
That’s right. GGT’s NAV was down -5.2% last week, one of the worst of all equity CEFs I follow, and yet its MKT price was up +8.5%.
It’s the most ridiculous valuation spread I have ever seen and it won’t last, even if it takes a distribution cut for GGT to happen first. The opportunity is so clear and yet nobody seems to recognize it.
Are you out there Cathie Wood?
Credit: Source link