
Leonardo Penuela Bernal/iStock via Getty Images
Are you seeking a company that’s considered a sound investment, with reliable cash flow generation and a high yield to support your retirement or income oriented investment goals?
Enterprise Products Partners L.P. (NYSE:EPD) should certainly be on your radar.
EPD boasts a $56.9 billion market cap and an enticing distribution yield of 7.63%, backed by a robust 1.7x distribution coverage ratio.
However, a substantial yield alone doesn’t guarantee an excellent investment. Many high-yielding companies turn out to be yield traps when their stock prices depreciate linearly with dividend payouts, resulting in zero or even negative total returns. For instance:
- British American Tobacco (BTI) with a dividend yield of 9.6% has returned a 10-year total return of -0.18%.
- Medical Properties Trust (MPW) yield of 12.2%, return -20.18%.
- Volkswagen (OTCPK:VWAGY) yield of 7.7%, return -29.1%.
Although EPD’s stock has also depreciated by nearly 20% over the past 10 years, it stands as a pure income play, delivering a reasonable total return of 54.8%.
This outperforms comparable peers like Energy Transfer (ET) and Enbridge (ENB), whose business models I find appealing as well.
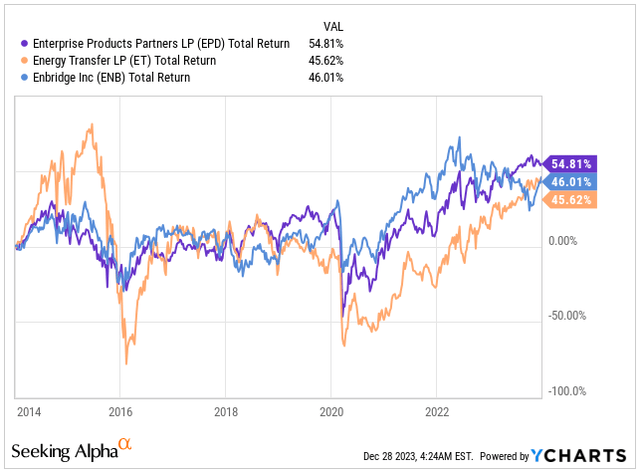
Total Return (Seeking Alpha)
Just a heads up, if you’re looking for dividend growth and price appreciation, this might not be the best bet for you. But if you’re after a steady income flow, especially in the midstream sector, you’re in the right place.
Let me break down why this passive income stream is a total no-brainer at today’s price.
Balance Sheet Strength And Bright Future For Fossil Fuels
In today’s investment landscape, many might question why put money into a business centered around transporting fossil fuels, given our societal push towards sustainable energy solutions like solar, wind, or hydropower.
But here’s the thing—while there’s talk of shifting away from fossil fuels, the reality paints a different picture.
Governments and nations may claim we’re moving on from fossil fuels, yet the consumption of coal, oil, and gas has skyrocketed from 1940 to today.
Moreover, over the past century, our global energy usage has surged alongside industrialization and a growing global population. Between 1965 and 2021, per capita energy consumption shot up by 61%. The upward trend in consumption has continued as technology has become even more prevalent in recent years.
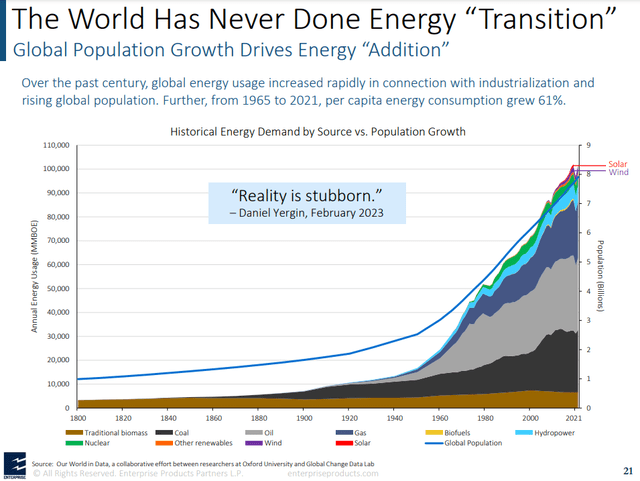
Energy Mix (EPD IR)
Personally, I’m all for the transition to net-zero and embracing more sustainable energy sources. But let’s face it, our entire society is essentially built upon these energy sources.
Recognizing that fossil fuels won’t disappear soon but might coexist with sustainable energy sources is crucial here.
EPD operates on a stable business model that isn’t highly vulnerable to oil and gas price swings. It generates consistent revenues through its expansive pipeline network spanning over 50,000 miles, transporting natural gas, natural gas liquids (NGLs), crude oil, petrochemicals, and refined products.
As a midstream infrastructure provider, EPD boasts storage facilities capable of holding over 260 million barrels of NGL, petrochemicals, refined products, and crude oil, along with the capacity to store 14 billion cubic feet of natural gas. Additionally, EPD has $6.8 billion worth of approved projects under construction, expected to contribute incremental fee-based revenues.
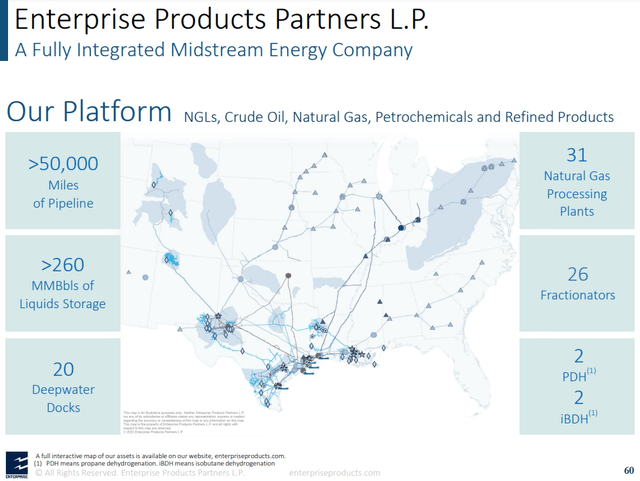
EPD Footprint (EPD IR)
EPD might not clinch the title of the largest energy midstream player in North America, but it certainly runs neck and neck. In fact, it stands notably larger than many of the industry’s biggest names, as illustrated in the graph below.
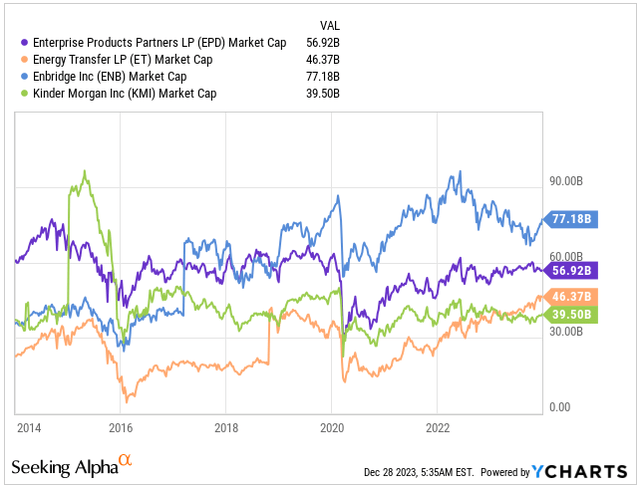
Market Cap (Seeking Alpha)
EPD offers a generous distribution, mostly tax-deferred, which remains a significant benefit. Similar to real estate, the depreciation in the midstream business tends to overstate the maintenance costs, ensuring the longevity of this tax-deferred advantage as long as the company continues to grow.
The midstream sector mirrors the stability of the utility business within the oil and gas industry. Oddly, the market doesn’t seem to acknowledge potential growth through acquisitions, despite EPD’s impressive track record in this area.
The lack of recognition for growth potential remains until the backlog of projects starts expanding, which is becoming more apparent in the current business cycle. EPD’s shift towards a self-funded growth model of its backlog has been pivotal.
This strategy enables the company to finance substantial growth initiatives without resorting to debt or equity markets. Not only does this approach minimize financial risk, but it also enhances returns on invested capital by reducing interest expenses in future projects.
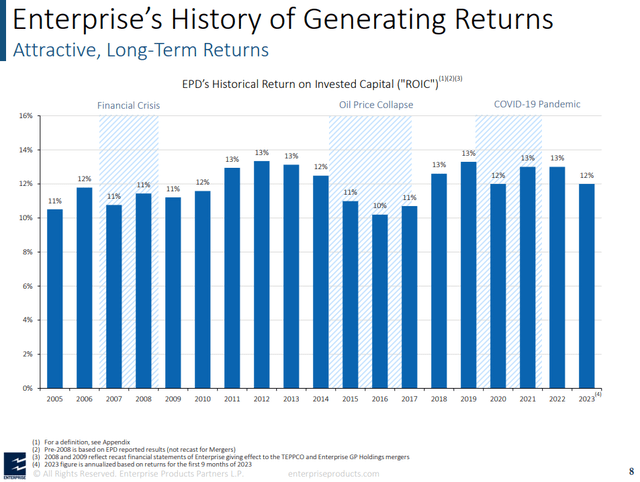
ROIC (EPD IR)
EPD’s reduced reliance on capital markets has noticeably fortified its balance sheet, distinguishing it as the midstream leader with the highest credit rating in its sector at A-/A3.
Managing debt maturity stands as a strong suit, with only $850 million in senior notes maturing in 2024 out of a total $34.9 billion issued. The average weighted cost of debt at 4.6%, primarily fixed-rate (95.8%), acts as a safeguard against the currently elevated rate environment.
Presently, the average term to maturity of EPD’s debt sits at 19.3 years. However, due to its self-financing strategy, this figure has been consistently diminishing.
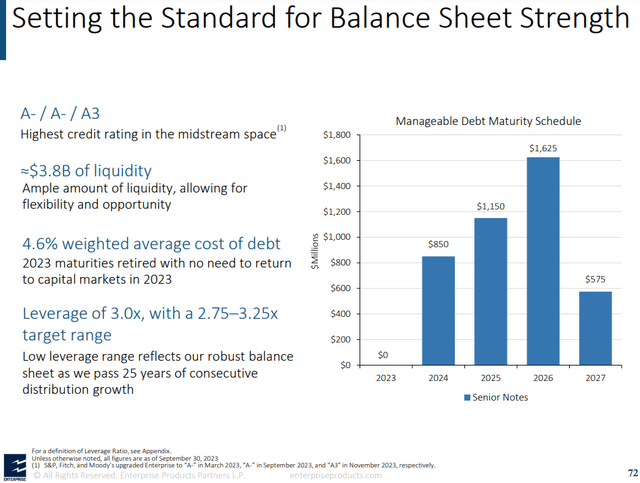
Balance Sheet Strength (EPD IR)
Maintaining a rock-solid balance sheet is pivotal for any energy company, especially given the economic fluctuations. EPD excels in this aspect, boasting one of the lowest debt-to-EBITDA ratios compared to its closest peers. This isn’t an anomaly but rather standard practice for them.
This low leverage isn’t solely a safety measure supporting EPD’s substantial yield; it also provides them with substantial flexibility. During economic downturns, they can rely on their robust financial position to fortify their operations and distributions.
Conversely, in times of prosperity, they have the resources to fuel their growth. This financial resilience empowers the company to adeptly navigate the usual ebbs and flows of the energy industry. That’s precisely why EPD stands out as my preferred midstream company.
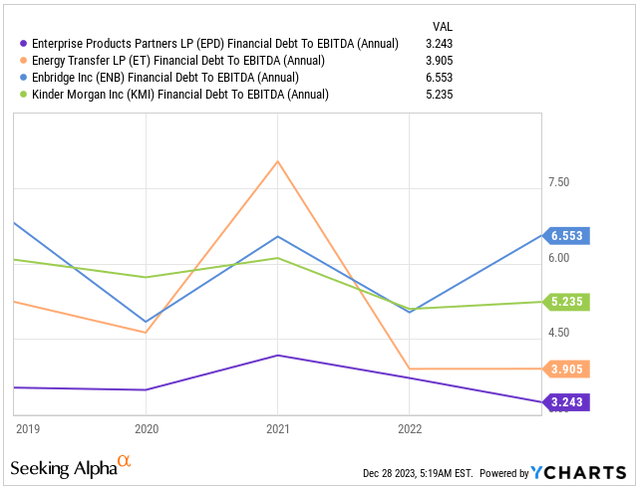
Debt-to-EBITDA (Seeking Alpha)
Distribution To Unitholders
In the realm of yields, while EPD boasts a substantial yield at 7.63%, it’s not the highest in the field:
- EPD’s yield: 7.63%
- ET’s yield: 9.06%
- ENB’s yield: 7.41%
- KM’s (KMI) yield: 6.36%
What sets EPD apart, however, is its robust balance sheet and the shift to a self-funding financial strategy for growth. This transition has enhanced operational efficiency, resulting in a robust distribution coverage of 1.7x in Q3 2023. This resilience was evident even during the tumultuous period of 2020 when commodities like oil plummeted into negative price territory.
EPD’s track record is impressive — it has increased its distribution for 25 consecutive years, earning the esteemed title of a dividend aristocrat. Over time, the company has returned $51 billion through LB distributions and unit buybacks.
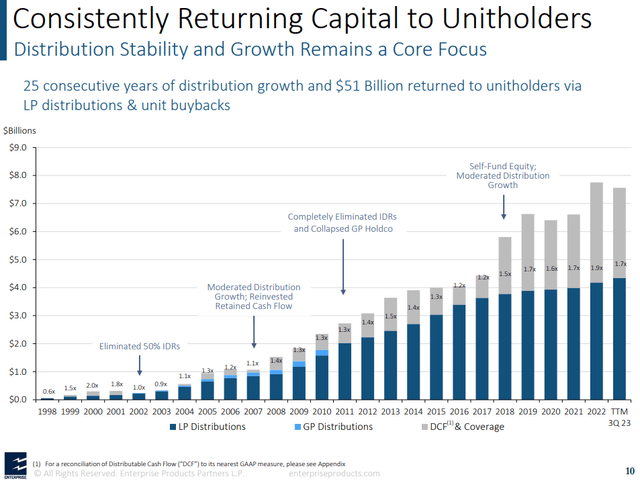
Coverage Ratio (EPD IR)
EPD recently increased its quarterly distribution by 2%, now standing at $0.50 compared to the previous $0.49.
Looking ahead, it’s clear that expecting double-digit distribution growth might not be realistic, despite the $6.8 billion worth of projects in various construction phases. However, the primary focus remains on safety and reliability of the already high distribution.
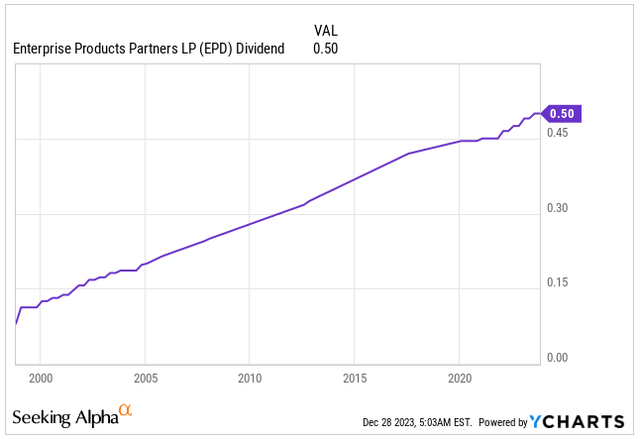
Dividend Per Share (Seeking Alpha)
Cheap, But Do Not Expect Significant Valuation Expansion
The outlook for fossil fuels appears pessimistic, especially considering the uncertainties surrounding the energy transition. Governments worldwide are making minimal efforts to disrupt the current energy infrastructure, which indicates a continued reliance on existing systems.
This suggests potential growth ahead for EPD. However, I anticipate this growth to fall within the range of 2% to 5%. This projection primarily stems from the company’s substantial size, where new projects might contribute relatively less to the overall landscape.
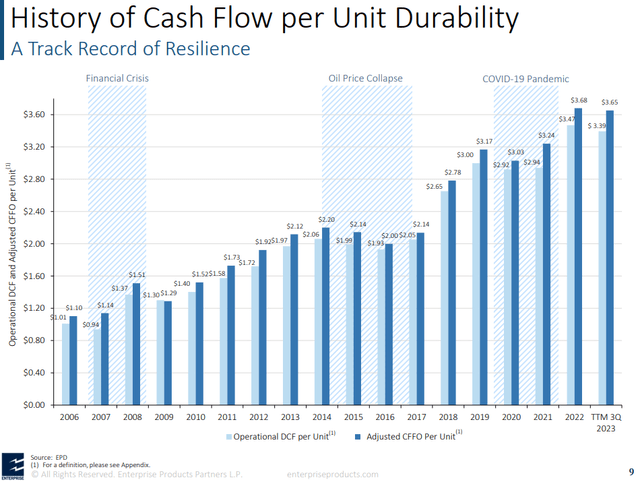
Cash Flow Growth (EPD IR)
The reduced growth trajectory reflects in the lower valuation. Currently, the stock trades at 10.7x its FY23 earnings.
This figure stands 8% lower than its 5-year average of 11.62x but slightly above the sector’s median of 9.32x.
However, I wouldn’t put excessive emphasis on the valuation. Given the prevailing negative sentiment towards fossil fuels and the sluggish growth projections, expecting any significant valuation expansion might be unrealistic.
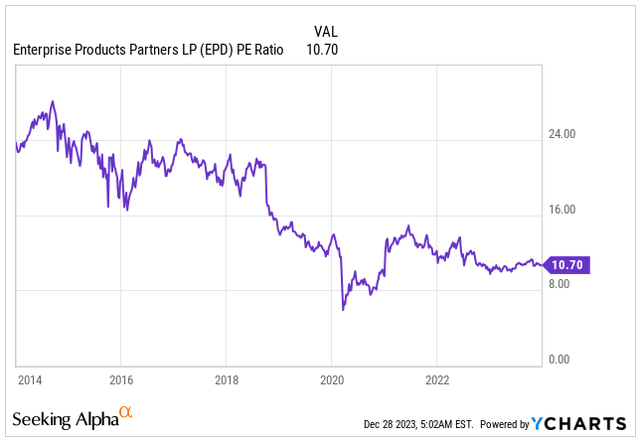
PE Ratio (Seeking Alpha)
What really matters are the robust balance sheet, strong distribution coverage, and the top-notch management consistently making prudent decisions.
For investors seeking income, I see this opportunity potentially yielding between 7% to 10% annually over the next three years.
Takeaway
Enterprise Products Partners checks all the boxes for income-seeking investors looking for a defensive bet.
It operates in a growing industry, sporting a strong balance sheet that’s steadily reducing leverage, with anticipated annual growth in the range of 2% to 5%.
Investors are treated to an enticing distribution yield of 7.63%, solidly supported by a leading 1.7x distribution coverage ratio.
Despite trading at a discount compared to its 5-year averages, and considering the prevalent negative sentiment towards fossil fuels, there seems to be a reasonable margin of safety.
For those eyeing income, this opportunity could potentially yield between 7% to 10% annually over the next three years.
Editor’s Note: This article discusses one or more securities that do not trade on a major U.S. exchange. Please be aware of the risks associated with these stocks.
Credit: Source link