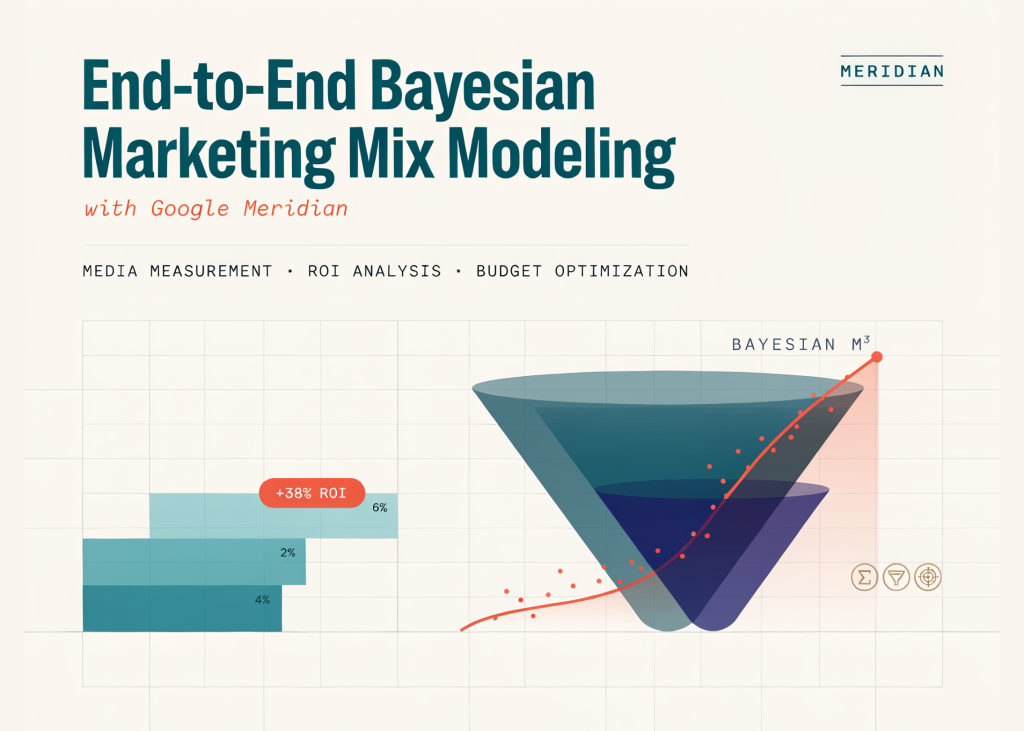

In this tutorial, we build a complete Bayesian marketing mix modeling workflow using Google Meridian. We begin by installing the required libraries, verifying GPU availability, and exploring a geo-level marketing dataset that includes media impressions, spend, controls, promotions, conversions, population, and revenue. We then map the raw columns to Meridian’s data schema, define interpretable ROI-based priors, and configure the model before fitting it with prior and posterior NUTS sampling. After training, we evaluate convergence and predictive accuracy, examine channel contributions, ROI, marginal ROI, effectiveness, adstock, saturation, and response curves, and use the Analyzer API to extract custom posterior metrics. We conclude the workflow by optimizing both fixed and flexible budgets, generating shareable HTML reports, and saving the fitted model for reuse.
!pip install --upgrade -q "google-meridian[and-cuda]"
import numpy as np
import pandas as pd
import altair as alt
import tensorflow as tf
import tensorflow_probability as tfp
from IPython.display import display, HTML
from meridian import constants
from meridian.data import load
from meridian.model import model
from meridian.model import spec
from meridian.model import prior_distribution
from meridian.analysis import analyzer
from meridian.analysis import visualizer
from meridian.analysis import optimizer
from meridian.analysis import summarizer
def show(chart_or_obj, title=None):
if title:
display(HTML(f"{title}
"))
display(chart_or_obj)
print("TensorFlow:", tf.__version__)
gpus = tf.config.experimental.list_physical_devices("GPU")
print("GPUs detected:", gpus if gpus else "NONE — sampling will be slow on CPU!")
CSV_URL = (
"https://raw.githubusercontent.com/google/meridian/refs/heads/main/"
"meridian/data/simulated_data/csv/geo_all_channels.csv"
)
df = pd.read_csv(CSV_URL)
print("\nShape:", df.shape)
print("Geos:", df["geo"].nunique(), "| Weeks:", df["time"].nunique())
print("Date range:", df["time"].min(), "->", df["time"].max())
display(df.head())
spend_cols = [c for c in df.columns if c.endswith("_spend")]
spend_share = df[spend_cols].sum().rename("total_spend").reset_index()
spend_share["share_%"] = 100 * spend_share["total_spend"] / spend_share["total_spend"].sum()
display(spend_share)
kpi_by_week = df.groupby("time")["conversions"].sum().reset_index()
show(
alt.Chart(kpi_by_week).mark_line().encode(
x=alt.X("time:T", title="Week"),
y=alt.Y("conversions:Q", title="Total conversions (all geos)"),
).properties(width=700, height=250),
"National KPI over time",
)
We install Google Meridian with GPU-enabled TensorFlow support and import the libraries required for modeling, visualization, and analysis. We verify the runtime environment, detect available GPUs, and load Meridian’s simulated geo-level marketing dataset. We also perform initial exploratory analysis by reviewing data dimensions, date coverage, spend distribution, and national conversion trends.
coord_to_columns = load.CoordToColumns(
   time="time",
   geo="geo",
   controls=["competitor_sales_control", "sentiment_score_control"],
   population="population",
   kpi="conversions",
   revenue_per_kpi="revenue_per_conversion",
   media=[
       "Channel0_impression",
       "Channel1_impression",
       "Channel2_impression",
       "Channel3_impression",
       "Channel4_impression",
   ],
   media_spend=[
       "Channel0_spend",
       "Channel1_spend",
       "Channel2_spend",
       "Channel3_spend",
       "Channel4_spend",
   ],
   organic_media=["Organic_channel0_impression"],
   non_media_treatments=["Promo"],
)
media_to_channel = {f"Channel{i}_impression": f"Channel_{i}" for i in range(5)}
media_spend_to_channel = {f"Channel{i}_spend": f"Channel_{i}" for i in range(5)}
loader = load.CsvDataLoader(
   csv_path=CSV_URL,
   kpi_type="non_revenue",
   coord_to_columns=coord_to_columns,
   media_to_channel=media_to_channel,
   media_spend_to_channel=media_spend_to_channel,
)
data = loader.load()
print("\nInputData loaded. Media tensor shape (geo, time, channel):", data.media.shape)
roi_mu = 0.2
roi_sigma = 0.9
prior = prior_distribution.PriorDistribution(
   roi_m=tfp.distributions.LogNormal(roi_mu, roi_sigma, name=constants.ROI_M)
)
model_spec = spec.ModelSpec(prior=prior)
mmm = model.Meridian(input_data=data, model_spec=model_spec)
We map the raw dataset columns to Meridian’s expected schema using CoordToColumns. We define paid media, spend, organic channels, controls, treatments, population, KPI, and revenue-related fields before loading the structured input data. We then configure ROI-based priors, create the model specification, and initialize the Meridian model.
mmm.sample_prior(500)
mmm.sample_posterior(
   n_chains=7,
   n_adapt=500,
   n_burnin=500,
   n_keep=1000,
   seed=1,
)
print("Sampling complete.")
model_diagnostics = visualizer.ModelDiagnostics(mmm)
show(model_diagnostics.plot_rhat_boxplot(), "R-hat convergence check (want < 1.05)")
show(
   model_diagnostics.plot_prior_and_posterior_distribution(),
   "Prior vs. posterior (ROI parameters)",
)
model_fit = visualizer.ModelFit(mmm)
show(model_fit.plot_model_fit(), "Model fit: expected vs. actual outcome")
display(model_diagnostics.predictive_accuracy_table())
media_summary = visualizer.MediaSummary(mmm)
display(media_summary.summary_table())
show(media_summary.plot_channel_contribution_area_chart(),
    "Outcome decomposition over time (baseline + channels)")
show(media_summary.plot_contribution_pie_chart(),
    "Share of outcome: baseline vs. media")
show(media_summary.plot_spend_vs_contribution(),
    "Spend share vs. contribution share (spot over/under-investment)")
show(media_summary.plot_roi_bar_chart(),
    "ROI by channel (with credible intervals)")
show(media_summary.plot_roi_vs_effectiveness(),
    "ROI vs. effectiveness (bubble = spend)")
show(media_summary.plot_roi_vs_mroi(),
    "ROI vs. marginal ROI — mROI drives optimization, not average ROI")
We sample from the prior and fit the Bayesian model using posterior NUTS sampling across multiple chains. We evaluate convergence using R-hat diagnostics, compare prior and posterior distributions, and assess model fit against observed outcomes. We also analyze predictive accuracy, channel contributions, ROI, marginal ROI, and media effectiveness.
media_effects = visualizer.MediaEffects(mmm)
show(media_effects.plot_response_curves(),
    "Response curves (incremental outcome vs. spend)")
show(media_effects.plot_adstock_decay(),
    "Adstock decay by channel")
show(media_effects.plot_hill_curves(),
    "Hill saturation curves by channel")
analysis = analyzer.Analyzer(mmm)
roi_draws = analysis.roi()
roi_np = np.asarray(roi_draws)
channels = list(data.media_channel.values)
roi_table = pd.DataFrame({
   "channel": channels,
   "roi_mean": roi_np.mean(axis=(0, 1)),
   "roi_p05": np.quantile(roi_np, 0.05, axis=(0, 1)),
   "roi_p95": np.quantile(roi_np, 0.95, axis=(0, 1)),
})
print("\nPosterior ROI summary (custom, from raw draws):")
display(roi_table)
p_better = (roi_np[..., 1] > roi_np[..., 0]).mean()
print(f"P(ROI Channel_1 > ROI Channel_0) = {p_better:.1%}")
summary_metrics = analysis.summary_metrics()
print("\nsummary_metrics() xarray variables:", list(summary_metrics.data_vars))
inc_outcome = np.asarray(analysis.incremental_outcome())
print("Incremental outcome draws shape (chains, draws, channels):", inc_outcome.shape)
We examine channel response curves, adstock decay, and Hill saturation behavior to understand diminishing returns and carryover effects. We use the Analyzer API to extract posterior ROI draws and calculate channel-level means and credible intervals. We also compute probabilistic channel comparisons, inspect summary metrics, and retrieve incremental outcome estimates.
budget_optimizer = optimizer.BudgetOptimizer(mmm)
optimization_results = budget_optimizer.optimize()
show(optimization_results.plot_budget_allocation(),
    "Optimized budget allocation")
show(optimization_results.plot_spend_delta(),
    "Recommended spend change per channel")
show(optimization_results.plot_incremental_outcome_delta(),
    "Incremental outcome gained by reallocating")
show(optimization_results.plot_response_curves(),
    "Response curves with current vs. optimal spend points")
flexible_results = budget_optimizer.optimize(
   fixed_budget=False,
   target_roi=1.5,
)
show(flexible_results.plot_budget_allocation(),
    "Flexible-budget allocation at target ROI = 1.5")
mmm_summarizer = summarizer.Summarizer(mmm)
mmm_summarizer.output_model_results_summary(
   "model_results_summary.html", "/content", "2021-01-25", "2024-01-15"
)
optimization_results.output_optimization_summary(
   "budget_optimization_summary.html", "/content"
)
print("Reports written to /content/model_results_summary.html "
     "and /content/budget_optimization_summary.html")
save_path = "/content/saved_mmm.pkl"
model.save_mmm(mmm, save_path)
mmm_reloaded = model.load_mmm(save_path)
print("Model saved and reloaded from", save_path)
roi_reloaded = np.asarray(analyzer.Analyzer(mmm_reloaded).roi()).mean(axis=(0, 1))
print("Reloaded ROI means:", np.round(roi_reloaded, 3))
print("\n" + "=" * 70)
print("TUTORIAL COMPLETE ✔")
print("Next steps with YOUR data:")
print("  1. Replace CSV_URL and CoordToColumns with your columns.")
print("  2. Calibrate per-channel ROI priors with experiment results.")
print("  3. Check R-hat < 1.05 before trusting any output.")
print("  4. Use holdout_id in ModelSpec for out-of-sample validation.")
print("=" * 70)
We optimize marketing spend under both fixed-budget and target-ROI scenarios. We visualize recommended allocations, spend changes, expected outcome gains, and optimized positions on response curves. We then generate HTML reports, save and reload the fitted model, and verify that the restored model reproduces the same ROI estimates.
In conclusion, we developed an end-to-end framework for measuring media performance and translating Bayesian model estimates into practical marketing decisions. We validated the model using convergence diagnostics and predictive metrics before interpreting channel-level results, helping us avoid relying on unstable or misleading estimates. We assessed each channel using contribution, ROI, marginal ROI, effectiveness, carryover, and saturation, and used posterior draws to quantify uncertainty and compare channels probabilistically. We then converted these insights into optimized budget allocations under fixed-budget and target-ROI scenarios. Finally, we exported the results and persisted the fitted model, allowing us to repeat analysis, test new scenarios, and adapt the workflow to real business data without rerunning the most computationally expensive steps.
Check out the FULL CODES here. Also, feel free to follow us on Twitter and don’t forget to join our 150k+ML SubReddit and Subscribe to our Newsletter. Wait! are you on telegram? now you can join us on telegram as well.
Need to partner with us for promoting your GitHub Repo OR Hugging Face Page OR Product Release OR Webinar etc.? Connect with us
Sana Hassan, a consulting intern at Marktechpost and dual-degree student at IIT Madras, is passionate about applying technology and AI to address real-world challenges. With a keen interest in solving practical problems, he brings a fresh perspective to the intersection of AI and real-life solutions.
Credit: Source link