

Richard Drury
The Western Asset Emerging Markets Debt Fund (NYSE:EMD) is a closed-end fund that provides income-focused investors with a good way to access emerging markets debt and earn a very high level of income at the same time. Emerging markets debt securities are commonly considered to be a desirable asset during periods in which the U.S. dollar is declining in value. This has been the case in general over the past year, as the US Dollar Index (DXY) is down by 2.53% over the past twelve months:
Seeking Alpha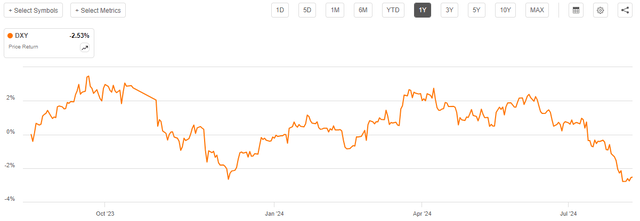
It seems likely that this decline will continue once the Federal Reserve embarks on its expected interest rate-cutting cycle in earnest, as the interest rate difference between the United States and many emerging markets increases. In fact, it is usual for a currency to decline in value when the central bank reduces interest rates, so this is nothing unusual.
Emerging markets securities have historically had much higher yields than most domestic or developed market bonds. This is reflected in the yield of the Western Asset Emerging Markets Debt Fund, which sits at 10.34% at the current share price. Here is how that compares to the fund’s peers:
|
Fund Name |
Morningstar Classification |
Current Yield |
|
Western Asset Emerging Markets Debt Fund |
Fixed Income-Taxable-Emerging Market Income |
10.34% |
|
Morgan Stanley Emerging Markets Debt Fund (MSD) |
Fixed Income-Taxable-Emerging Market Income |
11.62% |
|
Morgan Stanley Emerging Markets Domestic Debt (EDD) |
Fixed Income-Taxable-Emerging Market Income |
10.84% |
|
Templeton Emerging Markets Income Fund (TEI) |
Fixed Income-Taxable-Emerging Market Income |
10.14% |
|
Virtus Stone Harbor Emerging Markets Income Fund (EDF) |
Fixed Income-Taxable-Emerging Market Income |
13.90% |
As we can immediately see, pretty much all of these funds have significantly higher yields than can be obtained from most domestic-only bond funds. There are some multi-sector bond funds that can achieve similar yields, but those funds also include emerging market securities. Overall, though, we can clearly see that it is quite easy to obtain significantly higher yields than domestic bond funds can offer if one is willing to go into emerging nations.
Unfortunately, the Western Asset Emerging Markets Debt Fund is not the highest-yielding fund available in this sector of the market. However, it is still close to many of its peers. Honestly, though, this could be a good sign, as outsized yields are frequently a sign from the market that a fund may not be able to sustain its current payout. This fund’s current yield is not especially high when compared to others that invest in the same assets, so the market appears to be confident that it can sustain the current distribution. Naturally, we should do our own research on this, though, just in case the market is incorrect.
As regular readers may remember, we previously discussed the Western Asset Emerging Markets Debt Fund in early June of this year. The domestic bond markets have generally been pretty strong since that time due to growing expectations that the Federal Reserve will be lowering the federal funds rate beginning in September. However, emerging market bonds do not always trade based on the market’s expectations of Federal Reserve policies. The U.S. dollar has been declining a bit, though, so that may provide a bit of tailwind for the securities held by this fund. In addition, there may have been some traders or other investors seeking to lock in higher long-term yields than are available in the domestic market, so that could have stimulated demand for the securities held by this fund. As such, we can probably expect that the Western Asset Emerging Markets Debt Fund has delivered a reasonably attractive performance since our last discussion on it.
This is indeed the case, as shares of the Western Asset Emerging Markets Debt Fund are up 3.26% since my previous article on the fund was published:
Seeking Alpha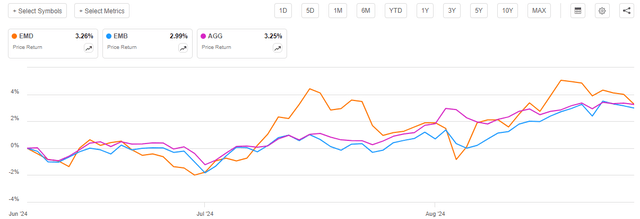
As we can immediately see, the fund’s shares outperformed the iShares J.P. Morgan USD Emerging Markets Bond ETF (EMB), which is perhaps the most comparable benchmark index for this fund. Interestingly, the fund’s shares also outperformed the Bloomberg U.S. Aggregate Bond Index (AGG), which has been riding high on expectations of an interest rate cut in September. In short, this fund’s performance has been reasonably good compared to other assets that bond investors might be holding, so we should probably be reasonably satisfied with it.
However, it is important to note that investors in this fund received more than just the share price appreciation during the period in question. As I explained in my previous article on this fund:
A simple look at a closed-end fund’s price performance does not necessarily provide an accurate picture of how investors in the fund did during a given period. This is because these funds tend to pay out all of their net investment profits to the shareholders, rather than relying on the capital appreciation of their share price to provide a return. This is the reason why the yields of these funds tend to be much higher than the yield of index funds or most other market assets.
When we include the distributions that the Western Asset Emerging Markets Debt Fund and both of the indices paid out over the roughly three-month period, we get this alternative performance chart:
Seeking Alpha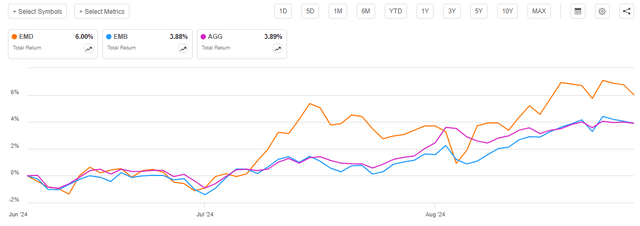
As we can see here, investors in the Western Asset Emerging Markets Debt Fund received a 6.00% total return over the period. This was far better than the two bond indices delivered. Perhaps surprisingly, we can see that the two bond indices had almost identical performance, despite the domestic investment-grade bonds delivering more capital gains. This is due to the fact that emerging market bonds have higher yields. Over extended periods of time, emerging market bonds will generally deliver a higher total return due to the fact that bonds do not have unlimited upside potential (due to interest rates not being able to go deeply negative) and the fact that emerging market bonds have much higher yields. For example, take a look at this fund’s total return along with the two indices over the past ten years:
Seeking Alpha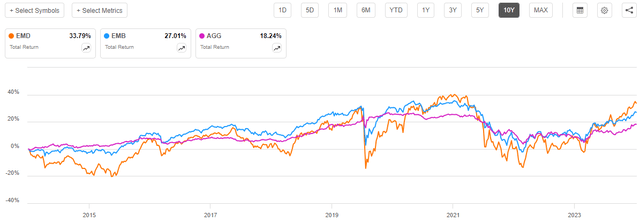
Here, we can clearly see that domestic investment-grade bonds were by far the worst asset to hold. The Western Asset Emerging Markets Debt Fund came out on top, although it was significantly more volatile. If we go with the classic saying that higher risk should result in higher reward and use volatility as a measure of risk, then this is exactly what we would expect to see.
As nearly three months have passed since our previous discussion on this fund, it would be logical to assume that there have been some changes in the market environment and the fund’s holdings. This fund also released an updated financial statement, so we will want to take a look at that to make sure that it is properly covering its distribution. The remainder of this article will focus on these tasks.
About The Fund
According to the fund’s website, the Western Asset Emerging Markets Debt Fund has the primary objective of providing its investors with a high level of current income. The website does not provide an in-depth description of the fund’s strategy, however. Rather, it states that:
[The Fund] offers an actively managed, leveraged fixed income portfolio that invests primarily in emerging market debt of sovereign and corporate issuers, denominated in both U.S. dollar and local currencies.
This is not a horrible description by any measure, as it does provide us with a few of the most important things for us to know. These are:
- The Fund invests its assets primarily in fixed-income securities issued by entities in emerging markets, and
- The Fund invests in both U.S. dollar-denominated and local currency-denominated assets.
However, it is not as descriptive as some of us might really want to know. For a better description, we can go to the fund’s annual report, which states:
The Fund’s primary investment objective is to seek high current income and its secondary investment objective is to seek capital appreciation. The Fund invests primarily in U.S. dollar and non-U.S. dollar denominated debt securities of issuers in emerging market countries. In selecting investments for the Fund, we use a combination of qualitative assessments and quantitative models that seek to measure the relative risks and opportunities of each market segment based on economic, market, political, currency and technical data. We also make an assessment of economic and market conditions to create an optimal risk/return allocation of the Fund’s assets among various segments of the emerging markets debt asset class.
After we make our sector allocations, we use traditional credit analysis to identify individual securities for the Fund’s portfolio. In selecting foreign and emerging market issuer debt for investment, we consider the economic and political conditions within the issuer’s country, overall and external debt service ratios, access to capital markets and debt service payment history.
Perhaps my biggest concern here is the use of the term “primarily,” as that suggests that the fund might invest in things other than emerging markets debt securities. Obviously, depending on what else is in the portfolio, that could cause the fund’s performance to differ from what we would expect from just a pure emerging markets debt fund.
A look at the fund’s schedule of investments in the semi-annual report (linked in the introduction) eases any potential concerns about this phrasing. This document provides the following asset allocation as of June 30, 2024:
|
Asset Type |
% of Net Assets |
|
Sovereign Bonds |
81.1% |
|
Corporate Bonds and Notes |
51.8% |
|
Senior Loans |
1.5% |
|
Common Stocks |
0.0% |
|
Convertible Bonds and Notes |
0.0% |
|
Short-Term Foreign Currency Bills |
0.6% |
|
Money Market Fund |
1.2% |
The senior loans are not what most readers likely expect, as these securities are not bank loans made to a corporation. In fact, they appear to be floating-rate loans made to the government of Tanzania:
Fund Semi-Annual Report
This is a U.S. dollar-denominated security, though, as the Tanzanian government is required to repay this loan using U.S. dollars instead of Tanzanian shillings. The floating interest rate also appears to be based on the Secured Overnight Financing Rate, which is a domestic interest rate that tends to be in line with the federal funds rate. We can see that it is not perfectly in line with the federal funds rate, though, as the Secured Overnight Financing Rate has exhibited some variance over the past year:
Federal Reserve Bank of St. Louis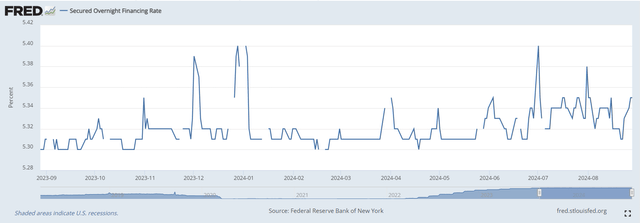
The effective federal funds rate has been 5.33% for the entire trailing twelve-month period, but we can see that the Secured Overnight Financing Rate has varied from 5.30% to 5.40% over the same period. It is a market-based rate set by the domestic repo market, but it tends to be close to the federal funds rate.
This is, therefore, an interesting security. It is not uncommon for foreign governments, especially emerging market ones, to borrow money in foreign currencies. In fact, most of the securities held by this fund actually require a foreign entity to make their debt payments in U.S. dollars. This is done in order to make it easier for foreign investors to purchase the bonds, as well as increase the trust that foreign investors have in the currency being paid to them. However, those are usually fixed-rate bond issues, so the foreign company or government knows exactly how much it will have to come up with in order to make the debt service payments. In the case of these Tanzanian loans, the interest rate will change based on economic conditions in the United States (assuming that the Federal Reserve actually makes its interest rate decisions based on American economic conditions) and has no relationship to economic conditions in Tanzania. Thus, there is a risk that the United States will have a very high-interest rate due to a strong domestic economy at the same time Tanzania needs low-interest rates due to problems there. That could strain the Tanzanian government’s ability to service the debt.
Presumably, the amount that the Tanzanian government borrowed under such an interest-rate regime is tiny in relation to its overall budget and economy, but this is still a risk that we should not ignore. At least, this particular security only accounts for 1.5% of the fund’s net assets.
The last time that we discussed the Western Asset Emerging Markets Debt Fund, we saw that 7.27% of the fund’s assets were invested in the United States. At the time, the United States was the second-largest country holding in the fund’s portfolio. This continues to be the case today:
Franklin Templeton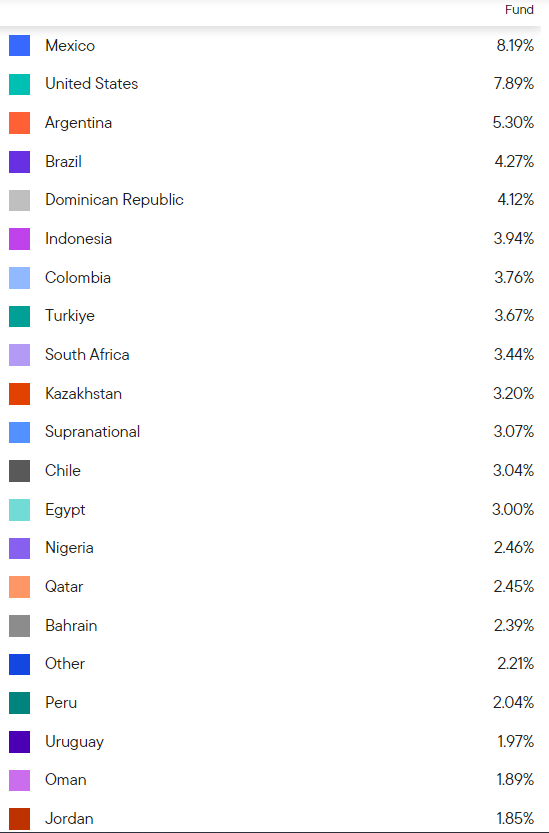
We can see that the fund’s allocation to the United States actually increased over the past few months. This is not what we would expect from an emerging markets debt fund, although it is admittedly somewhat understandable. As we saw in the introduction, American investment-grade bonds delivered better share price appreciation than emerging market bonds since our previous discussion. American junk bonds, on the other hand, underperformed emerging market bonds:
Seeking Alpha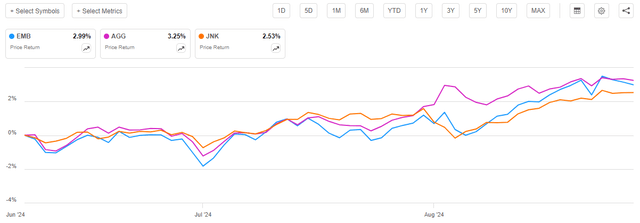
If the American securities held by this fund are investment-grade bonds, then the outperformance of these securities alone would cause the U.S. allocation to increase slightly. It is, however, difficult to tell what American bonds this fund actually holds. There are no U.S. Treasuries listed in the fund’s schedule of investments, except for the 1.2% cash-equivalent money market position. Likewise, the fund does not have any corporate bonds backed by an American company on the schedule of investments in the semi-annual report. It is possible that an emerging-market company issued bonds on an American exchange and the fund is classifying those as American bonds for some reason. The only other possibility that I can think of is that this fund lent out some of its bonds to a short seller and received U.S. Treasuries as collateral. We would think that any received collateral would be included in the schedule of investments, though. Likewise, the fund’s financial statements make no mention of any securities lending income. Thus, it is very difficult to determine where the U.S. country allocation is actually coming from.
Leverage
As is the case with most closed-end funds, the Western Asset Emerging Markets Debt Fund employs leverage as a method of boosting the effective yield of the securities in its portfolio. I explained how this works in my previous article on this fund:
In short, the fund borrows money and then uses that borrowed money to purchase bonds issued by emerging market sovereign nations and corporations. As long as the interest rate that the fund has to pay on the borrowed money is less than the yield that the fund receives from the purchased securities, the strategy works pretty well to boost the effective yield of the portfolio. This fund is capable of borrowing money at institutional rates, which are considerably lower than retail rates. In addition, the fund can borrow money in developed nations, which tend to have lower interest rates than most emerging markets. As such, it will usually be the case that the fund can borrow for less than it receives from its assets.
However, the use of debt in this fashion is a double-edged sword. This is because leverage boosts both gains and losses. As such, we want to ensure that the fund is not using too much leverage as that would expose us to an excessive amount of risk. I do not typically like to see a fund’s leverage exceed a third as a percentage of its assets for this reason.
As of the time of writing, the Western Asset Emerging Markets Debt Fund has leveraged assets comprising 27.51% of its portfolio. This represents a sharp decline from the 28.86% leverage that the fund had the last time that we discussed it. The fund’s share price did increase over the period, so this is somewhat expected.
As we have seen in a number of previous articles, there have been several closed-end funds that have seen their share price increase far more than their net asset value over the past few months. This is the case here as well, as the fund’s net asset value has only increased by 1.81% since the date of our previous discussion:
Barchart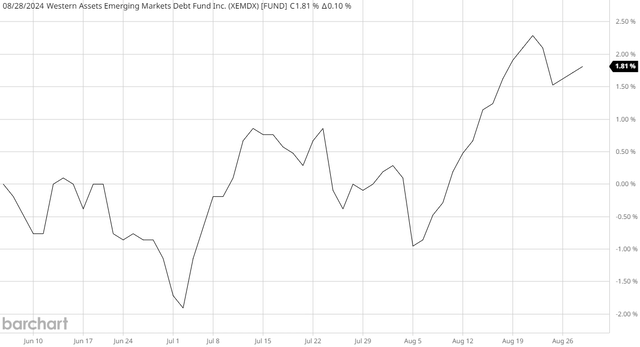
This is less than the fund’s share price increased over the period, which will naturally have an impact on its valuation. That will be discussed later in this article. For now, though, the important thing is that the fund’s portfolio has increased in size, so it makes sense for its leverage to go down.
Here is how the leverage of the Western Asset Emerging Markets Debt Fund compares to that of its peers:
|
Fund Name |
Leverage Ratio |
|
Western Asset Emerging Markets Debt Fund |
27.51% |
|
Morgan Stanley Emerging Markets Debt Fund |
0.00% |
|
Morgan Stanley Emerging Markets Domestic Debt |
12.62% |
|
Templeton Emerging Markets Income Fund |
15.41% |
|
Virtus Stone Harbor Emerging Markets Income Fund |
20.66% |
(all figures from CEF Data)
This could be concerning. As we can see, the Western Asset Emerging Markets Debt Fund has a substantially higher level of leverage than any of its peers. This could be a sign that the fund is employing too much leverage for the assets that it invests in. Thus, it might be exposing investors to more risk than is appropriate. While the fund has historically been able to handle its leverage fairly well, this could result in it having greater price volatility than the other funds in this category. That is something that could concern more risk-averse investors.
Distribution Analysis
The primary objective of the Western Asset Emerging Markets Debt Fund is to provide its investors with a very high level of current income. To this end, the fund pays a monthly distribution of $0.0845 per share ($1.014 per share annually), which gives it a 10.34% yield at the current share price.
Historically, the fund has not been especially reliable with respect to its distribution. In fact, it has exhibited considerable variation over the years:
CEF Connect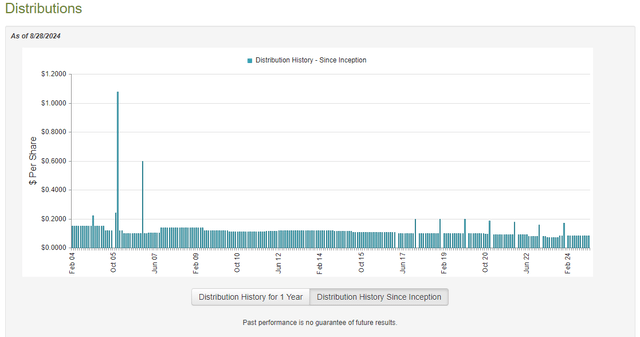
From the previous article:
As such, the fund may not appeal to those investors who are seeking to earn a consistent level of income from their portfolios that can be used to pay their bills or finance their lifestyles. However, fixed-income funds tend to change their distributions regularly as things such as interest rate changes can have significant impacts on the value of their assets. This fund does not have much foreign currency risk though, so that does not appear to be a problem here.
The fund’s current distribution is in line with what it had back when we last discussed it in June, but that is no guarantee that it is sustainable. So, let us have a look at the fund’s finances to make that determination.
The fund’s most recent financial report is the semi-annual report for the six-month period that ended on June 30, 2024. A link to this document was provided earlier in this article. This is a newer report than the one that we had available to us the last time that we discussed this fund, so it should work pretty well as an update.
For the six-month period that ended on June 30, 2024, the Western Asset Emerging Markets Debt Fund received $33,929,028 in interest and $61,927 in dividends from the assets in its portfolio. From this amount, we subtract the money that the fund had to pay in foreign withholding taxes. This gives the fund a total investment income of $33,944,816 for the six-month period. The fund paid its expenses out of this amount, which left it with $22,367,190 available for shareholders. This was insufficient to fully cover the $29,630,887 that the fund paid out in distributions during the period.
The Western Asset Emerging Markets Debt Fund was, unfortunately, unable to make up the difference through capital gains. For the six-month period, the fund reported net realized losses of $8,663,583, which were partially offset by $4,426,729 in net unrealized gains. Overall, the fund’s net assets declined by $11,500,551 after accounting for all inflows and outflows over the period. Thus, this fund failed to fully cover its distributions during the period.
The fund also failed to fully cover its distributions over the past eighteen months. On December 31, 2022, the fund had net assets of $616,807,549. As of June 30, 2024, the fund’s net assets have declined to $606,061,482. Thus, the fund has distributed more than it has brought in from its investments over the past year and a half. This is a concerning situation that suggests that the fund might have to reduce its distribution at some point if the market does not improve.
Valuation
Shares of the Western Asset Emerging Markets Debt Fund are currently trading at an 8.05% discount to net asset value. This is a slightly better price than the 7.90% discount that the shares have averaged over the past month.
Conclusion
In conclusion, emerging market bonds could be a good asset to hold as the Federal Reserve embarks on a monetary easing cycle. This is due to the fact that falling interest rates weaken the U.S. dollar and thus increase the international appeal of emerging market bonds. The fund appears to be nearly entirely invested in these assets, although it does claim to have a small amount of U.S. exposure. This fund has a few other issues as well, including that it is more leveraged than its peers and appears to be struggling to cover its distribution. Potential investors may want to keep these risks in mind before purchasing shares.
Credit: Source link