













































J Studios
Introduction
The WisdomTree Total US Dividend ETF (NYSEARCA:DTD), a $1.16bn sized product that seeks to cover over 800 all-cap dividend-paying stocks from the US, has not been in dazzling form over the past year. For context, over the last 12 months, it has managed to generate a little over ~12% returns, which is roughly only half as much as what the key benchmark has delivered.
YCharts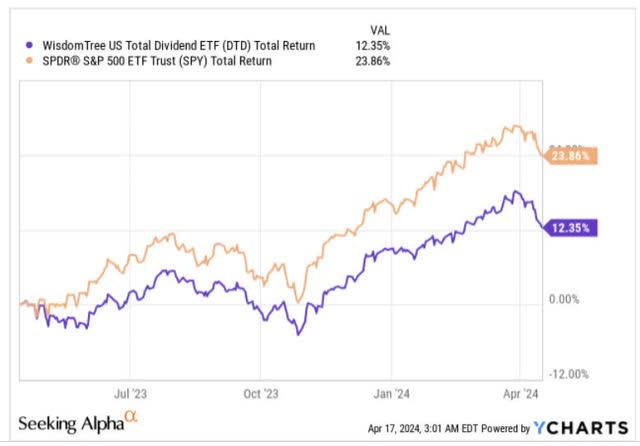
Looking ahead, we are not entirely convinced there’ll be a shift in this narrative. Nonetheless, here are a few reasons why we are not particularly excited about DTD.
A Few Reasons Why We’re Not Moved by DTD
This is not a criticism per se, but do note that DTD only focuses on US stocks (including REITs), and doesn’t consider ADRs (American Depository Receipts), or GDRs (Global Depository Receipts). Also, the intention here is to not just randomly pick out dividend-paying stocks across different market-cap spectrums (although the bulk of the portfolio is tilted towards giant and large-caps, which jointly account for 70% of the total portfolio), but to also incorporate some fundamental and momentum screeners before coming up with the eventual portfolio.
DTD’s stocks are eventually dividend-weighted every December (essentially a function of the projected cash dividend that will be paid by every stock, relative to the aggregate cash dividends of all the constituents), but before that takes place, prospective stocks also need to attain a certain composite risk factor score.
This risk factor score is equally-weighted between quality and momentum, where the latter takes into account metrics such as ROE, and ROA readings, gross profit over assets, and cash flow over assets. We remain unconvinced if the latter two metrics are appropriate enough to ascertain quality among financial stocks, as these companies are not overly incentivized to either generate high gross profits or generate and park a lot of idle cash relative to their asset base.
The other point to note is that the momentum factor looks at risk-adjusted returns over 6 and 12 months, and this could mean, there’s a good chance you end up with some overextended and pricey stocks that have already enjoyed their time in the sun.
In fact, do note that DTD’s forward valuations are not too compelling, with Morningstar data pointing to a P/E of over 17x. In contrast, if you look at the valuations of the most popular US dividend ETF around – the Schwab U.S. Dividend Equity ETF (SCHD), with $53bn in AUM, it can be bought at a much cheaper P/E of 13.8x.
SCHD also trumps DTD in a lot of other aspects. Firstly, it is a lot more economical, and can be accessed at an expense ratio of just 0.06%; that is over 4x lower than what DTD costs at 0.28%. Since these are dividend-themed products, you’re also hoping for some compelling income yield figures, but note that DTD’s current yield of 2.3%, is not just lower than its own 5-year average of 2.55%, but also around 130bps lower than what SCHD offers (note that SCHD also yields a figure that is around 30bps better than its 5-year average), dampening the long case even further.
YCharts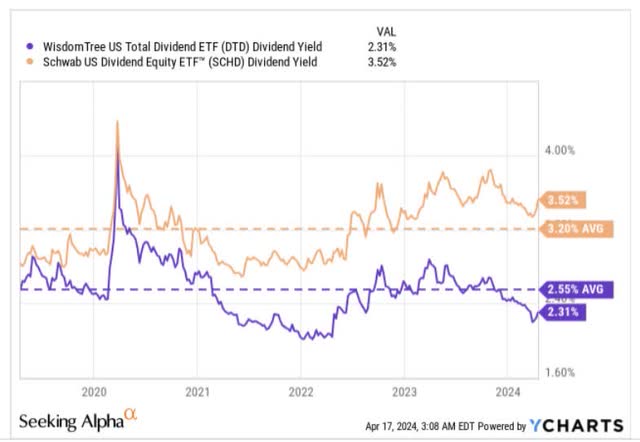
Then, when we review the performance of these two products since SCHD came to the market (SCHD got listed around 5 years after DTD), it makes us wonder even further if this is the best pick in this space.
Firstly, on a total return basis, we can see that DTD has lagged SCHD since the latter came to the market.
YCharts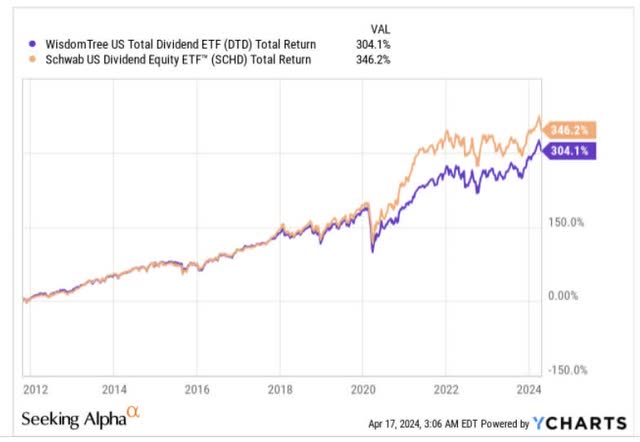
It isn’t just the variability in the total returns that’s worth noting. Even from a risk-adjusted return perspective, DTD comes across as the weaker option. The image below provides some context on how effectively these two products have sought to generate excess returns (returns over the risk-free rate), when dealing with their own standard deviations and downside deviations. The Sharpe ratio measures the excess return potential in light of the total risk taken, and here DTD’s reading is not even half as good as SCHD’s. The Sortino ratio gauges the quality of returns when only downside deviation is concerned, and here the gap between the two products is lesser, but still SCHD comes out on top.
YCharts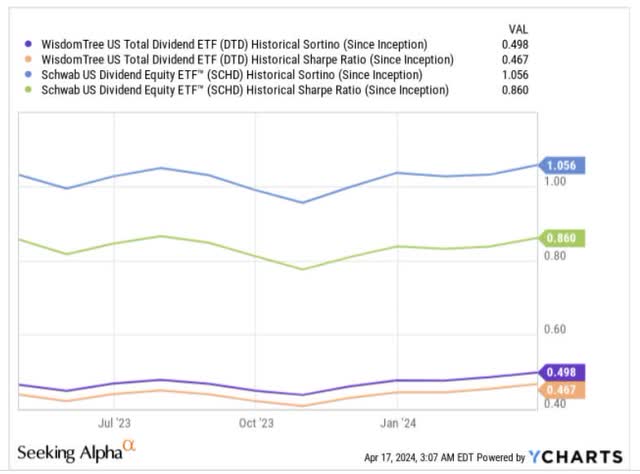
Also note that DTD’s top sector exposure is towards the financial sector, and we don’t feel prospects here look too bright, particularly as far as the distributions are concerned. At this stage of the cycle, we’re seeing a spike in charge-offs, which will prompt banks to set aside more funds for provisioning. The net interest income (NII) trajectory too seems to be declining as higher deposit costs start making their presence felt. In the current quarter, don’t expect any fireworks on the topline as banks are poised to deliver one of the lowest topline prospects (around 2% topline growth), which is better than only the materials sector.
FactSet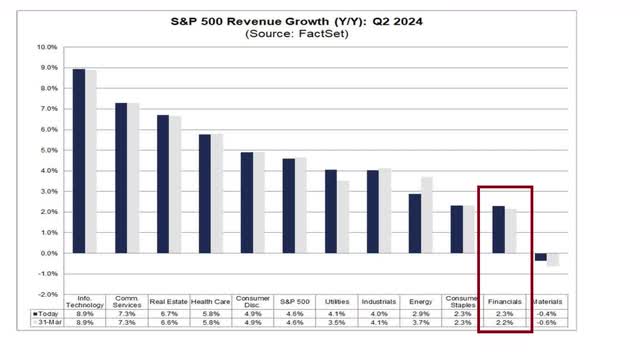
Crucially, it looks like the Basel III endgame framework may also cause banks to not be overly generous with their dividend distributions going forward.
Closing Thoughts – Technical Considerations
The developments on DTD’s weekly chart also suggest that now would not be a great time to buy this product. Firstly, note that the R:R is not great as the ETF is now a long way from its upward-sloping support (red line). Secondly, we’ve just seen the 22-week intermediate trendline (black line) give way, followed by some pretty sizeable red candles, handing the initiative to the bears. The next test will be to see how DTD fares as it approaches and trades around the $64-$65 levels, which had previously served as a key pivot point in Jan 2022, April 2022, July 2023, and Dec 2023/Jan 2024.
Investing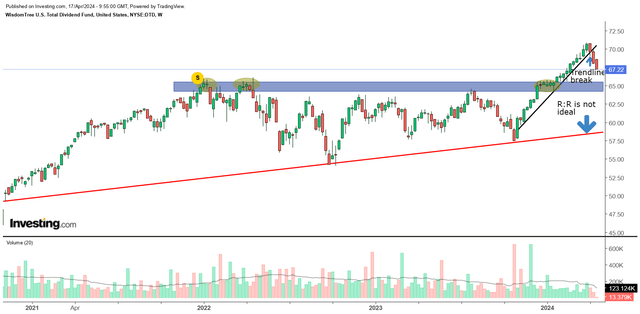
Credit: Source link










