
PM Images
I have been covering the Distillate U.S. Fundamental Stability & Value ETF (NYSEARCA:DSTL) since January 2022. Today, I would like to upgrade this investment vehicle that I rated a Hold twice in the past, including the September 2022 note, to a Buy. There are two reasons for that.
- First, DSTL has an exceedingly convincing performance track record, as it beat the iShares Core S&P 500 ETF (IVV) in 33 out of 61 of its full trading months since the launch in October 2018 and in four out of four of its full trading years.
- Second, there is a solid factor mix under the hood, with a plethora of adequately valued, cash-rich names with low leverage and impressive capital efficiency. I believe this combination should benefit from the current market environment.
Let us address all that in the article.
FCF-centered active strategy
According to page 5 of the prospectus, DSTL has changed its investment strategy this year:
Prior to April 3, 2023, the Fund operated as an index-based ETF that sought to track the performance of the Distillate U.S. Fundamental Stability & Value Index.
The fact sheet available on its website says the fund
…holds approximately 100 large-capitalization U.S.-listed stocks, systematically selected using the firm’s proprietary measures of quality and free cash flow based valuation. The fund seeks to generate long-term excess returns by avoiding stocks of companies that possess high levels of financial indebtedness, and owning those stocks that exhibit a high degree of fundamental stability and the most attractive valuations based on normalized free cash flow.
I would say that the current strategy is based on principles mostly similar to those that were at the crux of the index it tracked, i.e., it is still focused on low leverage (measured, as page 3 of the prospectus says, using the “proprietary debt-to-income calculation”), fundamental stability (defined as “the volatility of the company’s historical and projected cash flows”), and attractive valuation (assessed via FCF yield). I provided a more in-depth review of its methodology in the January 2022 article. In this regard, I will be discussing the period since DSTL’s inception in the performance analysis section.
DSTL portfolio: top-quality, adequately leveraged names, a few nuances as well
As of December 22, DSTL had a portfolio of 98 stocks, with Alphabet (GOOGL) being its largest position with a 3.8% weight. Regarding sectors, compared to IVV, DSTL meaningfully underweighted information technology in favor of the industrial sector, which has about 22% weight. I suppose this happened mostly because IT names tend to trade at a premium to the market. As illustrated below, other sectors that saw their weights boosted are consumer discretionary and health care. The funds’ exposures to consumer staples and communication services are on par. Unlike IVV, DSTL has no exposure to utilities.
Created by author using data from the fund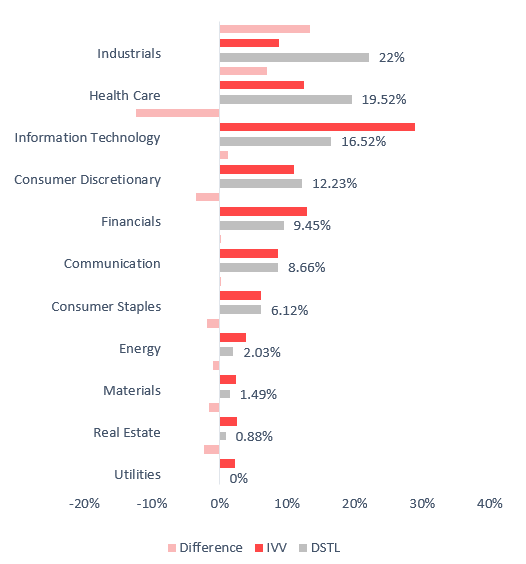
As I said above, DSTL has a factor story I like. More specifically, I argue that the fund has:
- mostly strong value exposure, though investors should be prepared for compromises;
- quality characteristics that are close to excellent;
- not much growth exposure, but with a few notable growth stories under the hood nonetheless.
Let me support all of these with the facts presented in the following table:
| Metric | 22-Dec |
| Market Cap | $166.96 billion |
| EY | 4.42% |
| EBITDA/EV | 6.84% |
| FCFY (FCF/Market Cap) | 5.15% |
| FCFY (FCF/Enterprise Value) | 4.45% |
| ROA | 10.08% |
| ROTC | 15.94% |
| Total Debt/EBITDA | 2.18 |
| Revenue Fwd | 5.47% |
| EPS Fwd | 7.83% |
| Quant Valuation B- or better | 15.1% |
| Quant Valuation D+ or worse | 59.94% |
| Quant Profitability B- or better | 97.3% |
| Quant Profitability D+ or worse | 0.88% |
Calculated by author using data from Seeking Alpha and the fund
My calculations show that DSTL has a weighted average market cap of almost $167 billion, but it would be premature to draw the conclusion that the portfolio is completely dominated by mega-caps. In fact, they account for only about 35%, and the figure is significantly influenced by GOOGL, which has a $1.77 trillion market cap. The rest of the basket consists of large-caps and just a handful of mid-cap names, accounting for 5%.
Nevertheless, as a result of the size premium, DSTL’s earnings yield is just 4.4%, while IVV, for example, has an EY of 4.2%. I suppose most value investors would point out here that this is below their comfort zone. So does that mean the fund has a market-like valuation? I will comment on that shortly.
Next, only 15.1% of the holdings have a Quant Valuation grade of B- or lower, while almost 60% earned a D+ rating or worse. The corollary here is that most of the fund’s net assets are allocated to companies that are trading at a premium to their 5-year average ratios and/or sector medians. Again, this is the consequence of the size and, most likely, quality premia. So value investors should be prepared for compromises.
Anyway, let us look at that issue from a different angle. A nice alternative to the EY is its debt-adjusted version or EBITDA/EV. And it tells a somewhat different story. DSTL has that metric at 6.8%, while IVV has just ~5.1%, though an important remark is that I calculated this figure excluding the financial and real estate sectors. Besides, DSTL has both market cap- and EV-based FCF yields at fairly healthy levels (5.15% and 4.45%, respectively).
To give a bit more color, I prepared the scatter plots combining the Return on Total Capital and EBITDA/EV of IVV’s (84.3% of the portfolio) and DSTL’s holdings. I have removed the following S&P 500 constituents with negative EV/EBITDA:
| Ticker | Company | Sector |
| (MRNA) | MODERNA, INC. | Health Care |
| (WDC) | WESTERN DIGITAL CORP | Information Technology |
| (NRG) | NRG ENERGY, INC. | Utilities |
DSTL ROTC, EBITDA/EV analysis (Created by the author using data from Seeking Alpha and DSTL) IVV ROTC, EBITDA/EV analysis (Created by the author using data from Seeking Alpha and IVV)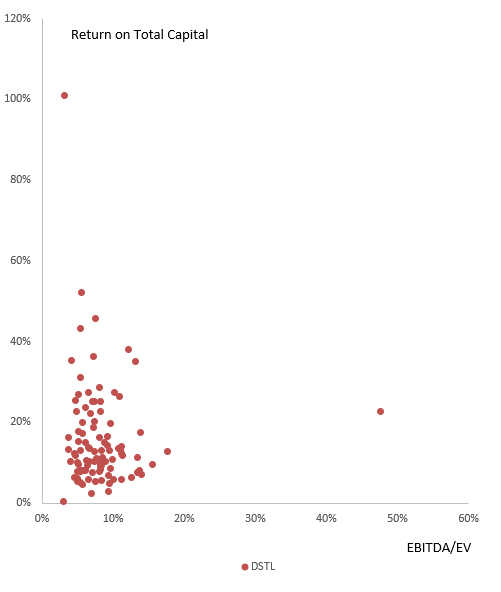
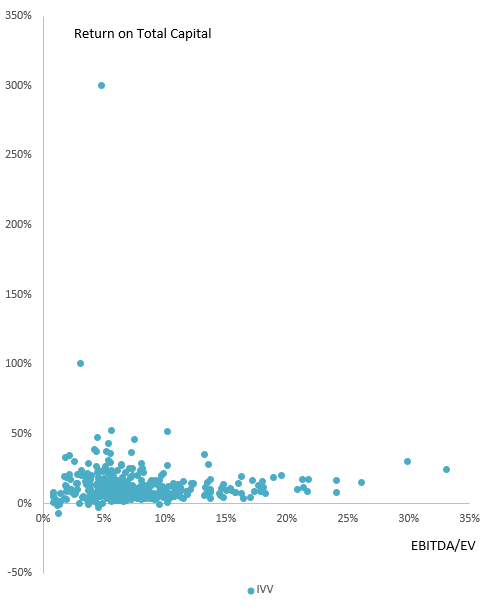
We see that IVV has exposure to ROTC-negative companies, while DSTL does not. This is one of the reasons why the ETF has such a strong weighted average figure at almost 16%, as per my calculations, while IVV’s result is around 14% (excluding financials and real estate). Another indication of DSTL’s robust quality is that over 97% of its holdings have a Quant Profitability rating of B- or higher. A weighted average Total debt/EBITDA of just 2.18x is also telling.
Finally, the fund has only single-digit weighted average forward growth rates. Nevertheless, there are still a few notable revenue growth stories in this portfolio, like Fortinet (FTNT) and Broadcom (AVGO).
Returns: beating the market with ease over the long run
DSTL has had a mostly robust performance since its inception in 2018, beating IVV consistently in 2019–2022. It has been performing a bit softer this year, but I suppose this is not an indication of the strategy losing its edge over simpler alternatives.
IVV and DSTL comparison (Created by the author using data from Portfolio Visualizer)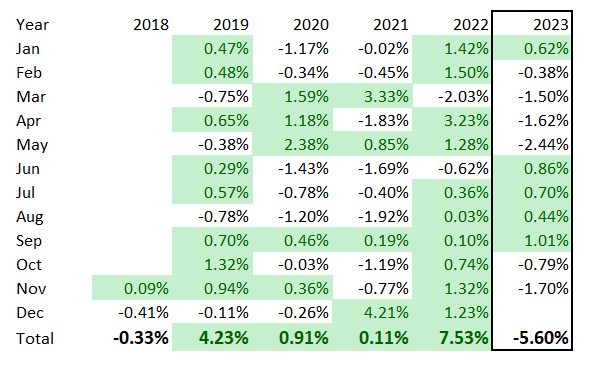
What is interesting is that DSTL has also beaten a few FCF-focused counterparts, including the Pacer US Cash Cows 100 ETF (COWZ) and the FCF US Quality ETF (TTAC).
| Portfolio | IVV | DSTL | COWZ | TTAC |
| Initial Balance | $10,000 | $10,000 | $10,000 | $10,000 |
| Final Balance | $18,367 | $19,841 | $19,636 | $15,905 |
| CAGR | 12.70% | 14.43% | 14.20% | 9.56% |
| Stdev | 18.85% | 19.05% | 22.86% | 18.89% |
| Best Year | 31.25% | 35.48% | 41.70% | 26.04% |
| Worst Year | -18.16% | -10.63% | -8.45% | -15.74% |
| Max. Drawdown | -23.93% | -19.56% | -27.84% | -24.89% |
| Sharpe Ratio | 0.63 | 0.71 | 0.61 | 0.48 |
| Sortino Ratio | 0.97 | 1.16 | 0.96 | 0.72 |
| Market Correlation | 1 | 0.97 | 0.89 | 0.97 |
Data from Portfolio Visualizer. The period analyzed is November 2018–November 2023.
While having the highest annualized return, DSTL has also delivered a much more comfortable maximum drawdown.
I believe it is also worth comparing DSTL’s performance to the results delivered by a novel vehicle, the VictoryShares Free Cash Flow ETF (VFLO), which was incepted in June 2023.
Price return (Seeking Alpha)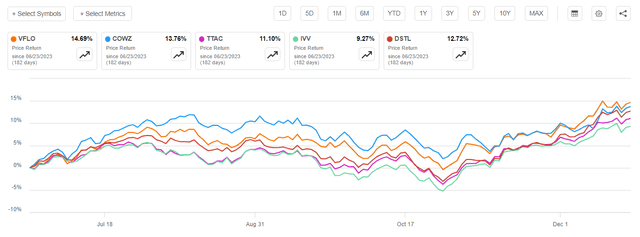
VFLO has outperformed DSTL, as well as the market (represented by IVV) and other peers, with both total and price returns being higher. DSTL has had the third-strongest total return.
Total return (Seeking Alpha)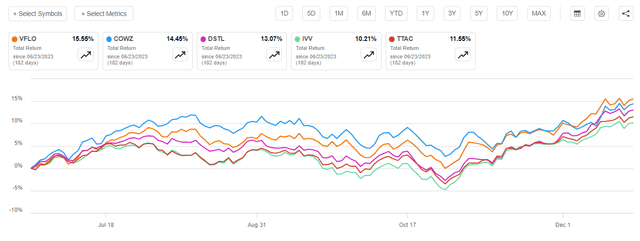
I have assigned a Buy rating to VFLO earlier this December, and I still believe FCF-focused investors should consider this ETF, together with DSTL.
Investor takeaway
In sum, I believe alpha-generating DSTL is positioned for strong gains going forward. Now actively managed, the fund offers a nice balance of value and quality, with a tilt toward the latter. Besides, for an active strategy, the ETF has a modest expense ratio of just 39 bps, while assets under management are impressive at $1.5 billion, and so is its liquidity overall.
Credit: Source link