

Adam Gault
In this article, we take a quick look at the patterns of the current CEF sell-off and highlight a number of potential opportunities in the space.
We see that the start of the most recent sell-off has roughly coincided with the start of April. Specifically, the S&P 500 hit a local high on 28-Mar and has since fallen 4.6%. The pattern of the CEF market is similar to what we have come to expect in these situations.
Systematic Income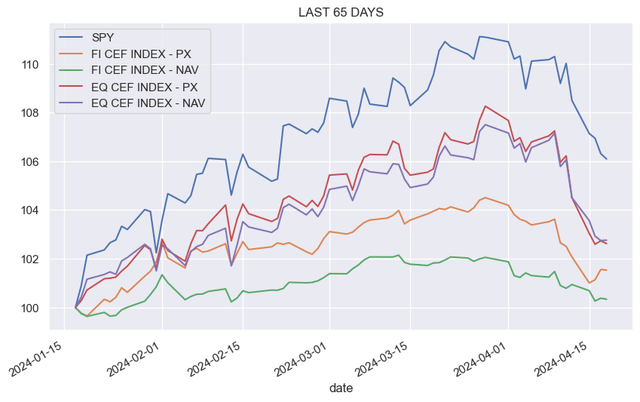
One, equity funds have fallen more than fixed-income funds. Two, prices have fallen more than NAVs (i.e. discounts have widened). Three, leveraged funds have mostly fallen more than un-leveraged funds. Four, higher-beta sectors have underperformed with some exceptions (i.e. MLPs which were helped by the rise in energy prices). In this sense, this current sell-off is par for the course as far as these things go.
The extent of the sell-off has so far been fairly modest. We can see this in the monthly total return chart below, where the drop over April (which captures nearly all of the sell-off) is not much bigger in absolute terms than the gain over March. Perhaps more importantly, the year-to-date gains are still in place.
Systematic Income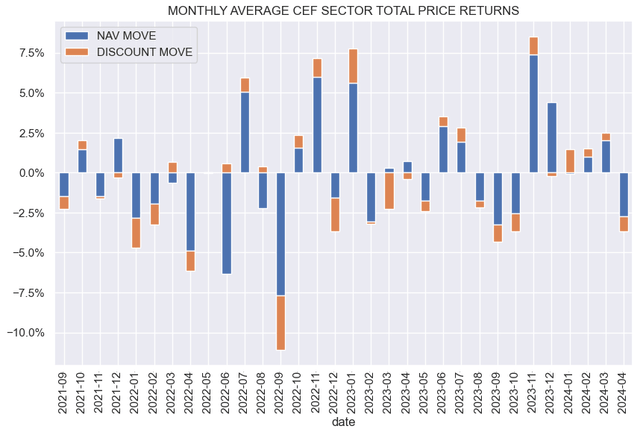
If we zoom out quite a bit, we see that this most recent sell-off has only taken off about a fifth of the previous 22% rally from the October of last year.
Systematic Income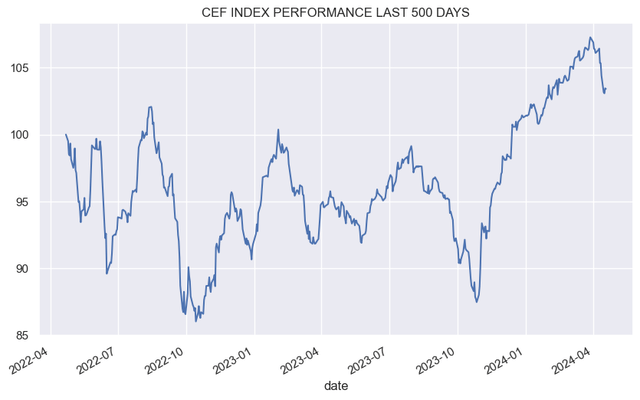
Turning to discounts, fixed-income CEF discounts (orange line) remain significantly tighter than the wides of last year. Equity CEF discounts, however, look depressed.
Systematic Income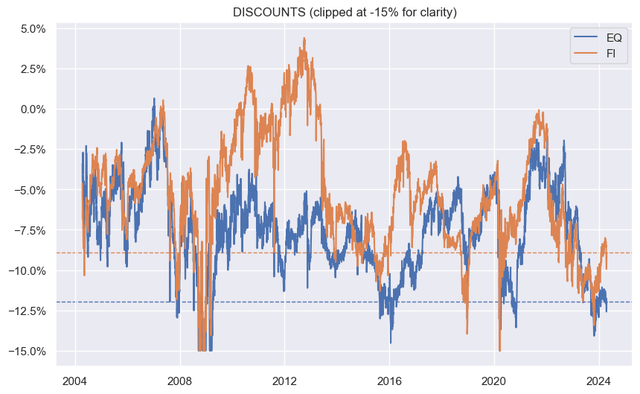
Drilling into sector performance, we see that REITs are by far the worst-performing sector over the month – not surprising given their sensitivity to both higher interest rates as well as lower stock prices. EM Debt and other equity-linked sectors are some of the other underperformers given their higher-beta profile. Loan CEFs are mostly unchanged as they are relatively immune to rising longer-term rates.
Systematic Income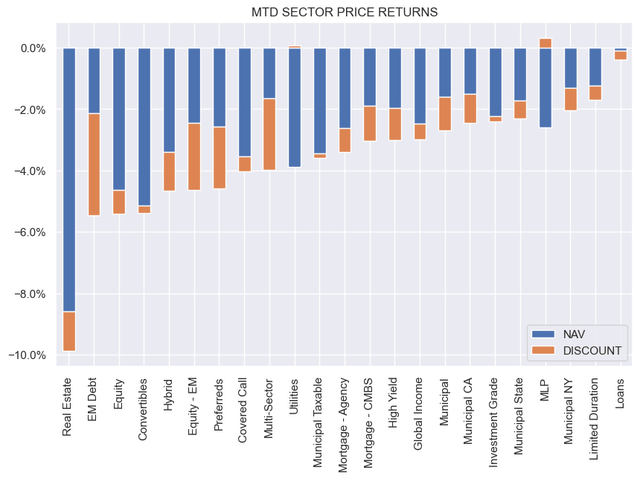
Credit spreads have started to rise from an extremely tight level. However, they haven’t moved enough to shift us from a higher-quality stance. Another rise of similar proportions would start to make certain higher-yielding assets more compelling.
FRED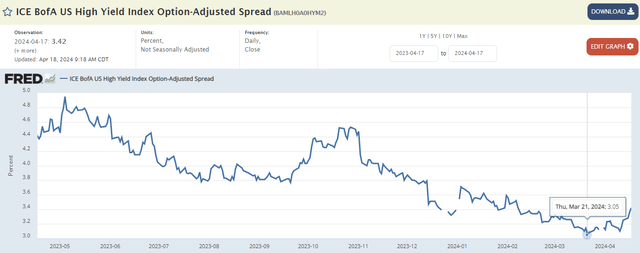
The yield curve has retraced some of its inversion, making longer-duration assets a little more interesting.
Systematic Income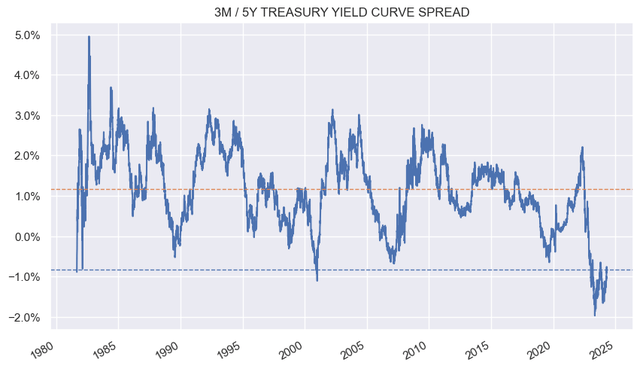
Perhaps a more relevant yield curve metric is not today’s 3-month rate (the proxy for the base rate of floating-rate assets like loans) vs. the 5-year rate (the proxy for the base rate of fixed-rate assets like corporate bonds) but the consensus future “steady state” 3-month rate of 2.5-3.75% (depending on the market or Fed forecast) vs. today’s 5-year rate of 4.68%. In short, longer-duration assets should eventually offer a yield pickup of 1-2% over floating-rate assets, all else equal. This means that investors should strongly consider adding some longer-duration assets to their portfolios today.
Chatham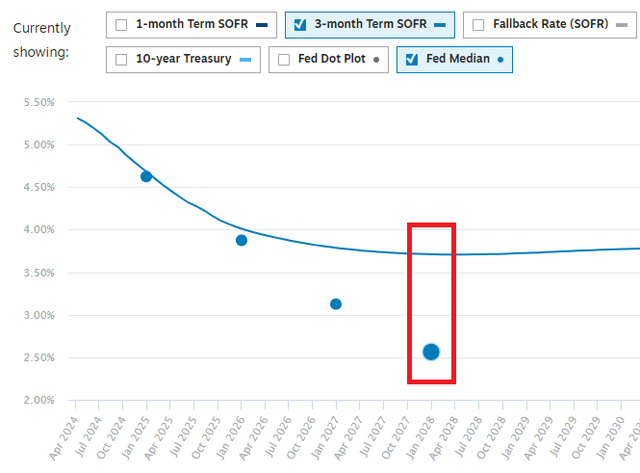
At the moment, we continue to favor a barbelled allocation to both floating-rate as well as longer-duration / higher-quality assets. However, in our view, the higher longer-term rates go the more compelling longer-duration assets will be and the more the barbell will shift to the right of the yield curve.
Some Ideas
One sector that fits the longer-duration / higher-quality profile is, of course, the tax-exempt Municipal sector. One challenge with the sector, however, is that it is less appropriate for investors in tax-deferred accounts. For these investors, the taxable Municipal could work best. In this sector, the Nuveen Taxable Municipal Income Fund (NBB) looks reasonable, trading at a 9.8% discount and a 6.06% current yield. The fund looks considerably better than GBAB – another fund in the sector that has a hybrid taxable muni / corporate flavor. The effective duration of NBB is a relatively high 10.6, meaning a little goes a long way with this fund.
Systematic Income CEF Tool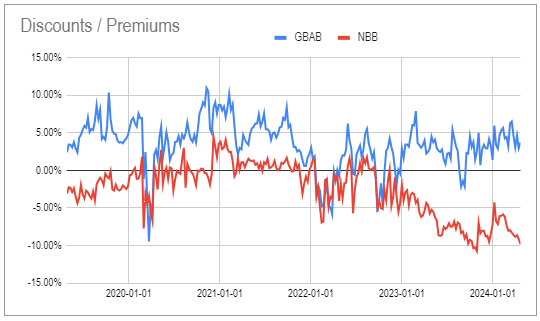
We continue to like the preferreds sector, with the Flaherty suite looking increasingly more compelling. The suite has hiked distributions for the second time in recent months, in anticipation of an eventual drop in leverage costs. The valuation of a fund like PFO is also attractive. We hold the Preferred and Income Opportunity Fund (PFO) which trades at a 14.2% discount and a 7.2% yield.
Systematic Income CEF Tool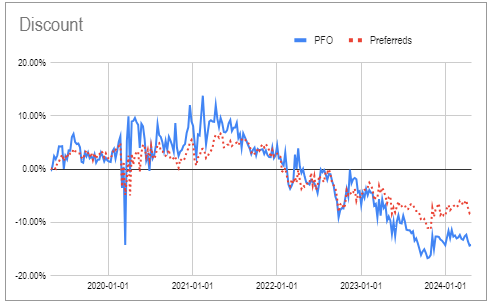
With credit remaining relatively expensive, one strategy is to underweight credit and add other investment strategies such as equity covered calls and Agency MBS. The PIMCO Global StocksPLUS & Income Fund (PGP) is one fund that diversifies across a number of such strategies. The fund has outperformed the average PIMCO taxable CEF in total NAV terms over the longer term; however, it remains at a deep discount valuation vs. the suite, as shown below.
Systematic Income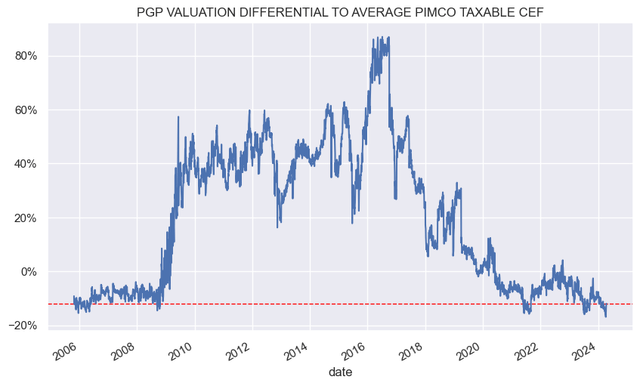
The Saba Capital Income & Opportunities Fund (SABA) is the second CEF taken over by the CEF activist Saba. The company has a very strong track record with their longer-term vehicle ETF (CEFS). At the moment, SABA holds a combination of CEFs and credit securities, and we expect the allocation to CEFs to increase to around a third – a level of its other CEF BRW. Because SABA has a significantly lower management fee vs BRW, we expect its discount to converge towards that of BRW. SABA trades at a 14.5% discount and a 9.35% current yield.
Systematic Income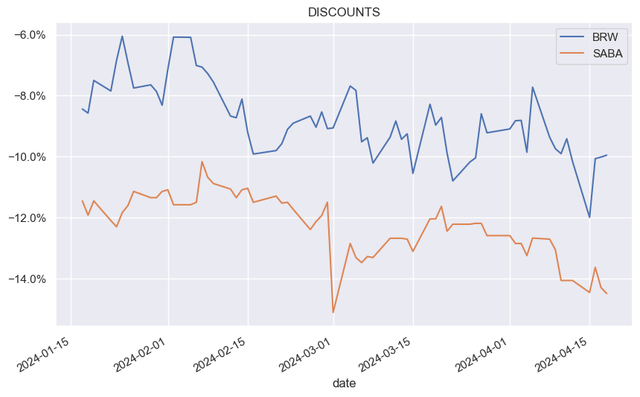
A pair of DWS Municipal CEFs are terminating (KSM this year and KTF potentially in 2026) with the DWS Strategic Municipal Income Trust (KSM) trading at a relatively wide discount of 4.5% and current yield of 3.5%. It presents an attractive holding in the current environment of high Treasury yields, very tight corporate credit spreads and additional alpha i.e. “pull to NAV” from the termination.
Editor’s Note: This article covers one or more microcap stocks. Please be aware of the risks associated with these stocks.
Credit: Source link