
DNY59/iStock via Getty Images
The CVS Investment Thesis Looks More Attractive After The Steep Sell-Off
We previously covered CVS Health (NYSE:CVS) in January 2023, suggesting the dangers of the aggressive M&A activities in the virtual and primary healthcare market then. With the company similarly embarking on costly acquisitions during these elevated interest rate environment, we had concluded that the stock might remain volatile through 2023.
CVS 5Y EV/Revenue and P/E Valuations
S&P Capital IQ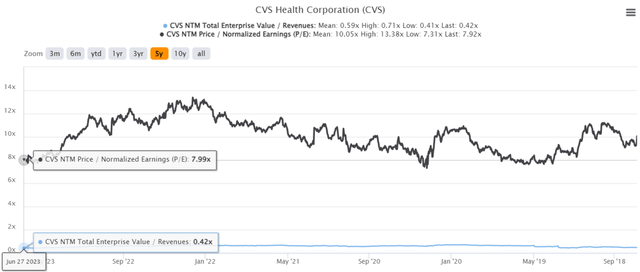
True enough, CVS’ valuations have been moderated to NTM EV/ Revenues of 0.42x and NTM P/E of 7.99x, lower than its 5Y mean of 0.59x and 10.05x, respectively. The same has been observed against its 1Y mean of 0.53x and 10.15x, respectively.
Then again, we believe the pessimism embedded in its valuations is unwarranted, due to the sustained growth in its well-diversified business operations and nearly doubled annualized top line to $339.76B by the latest quarter (+1.7% QoQ/ +10.8% YoY).
Through its series of acquisitions over the past few years, CVS has also grown its revenues at a CAGR of +11.8% since FY2017, albeit with a more than doubled long-term debt of $56.45B (+15% QoQ/ +8.4% YoY) by the latest quarter.
Investors must also note the sum may grow to approximately $61.45B by the next quarter (+8.8% QoQ/ +24.4% YoY), thanks to the $5B term loan agreement completed in May 2023, against the $21.51B reported in FY2017.
Then again, the sustained expansion in CVS’ businesses naturally triggered the ballooning annualized operating expenses to $38.12B (-5.4% QoQ/ +2.2% YoY), compared to $18.73B in FY2017. This cadence is likely affected by the rising inflationary pressure as well, compressing its gross margins to 15.4% by the latest quarter (-0.8 points QoQ/ -1.9 YoY).
The burgeoning long-term debt has also been impacted by the Fed’s sustained hikes thus far, with the company recording annualized interest expenses of $2.35B (+6.7% QoQ/ inline YoY) by the latest quarter. The management has further guided a sum of $2.7B by the end of 2023 (+18.4% YoY), thanks to the Signify and Oak Street acquisition.
Therefore, it is unsurprising that these headwinds have translated to an underwhelming FY2023 cash flow from operation guidance of $13B (-19.7% YoY) at the midpoint. Combined with the capital expenditure of $2.9B at the midpoint (+6.6% YoY), we may see CVS’ FCF generation impacted to $10.1B (-24.9% YoY).
CVS 1Y Stock Price
Trading View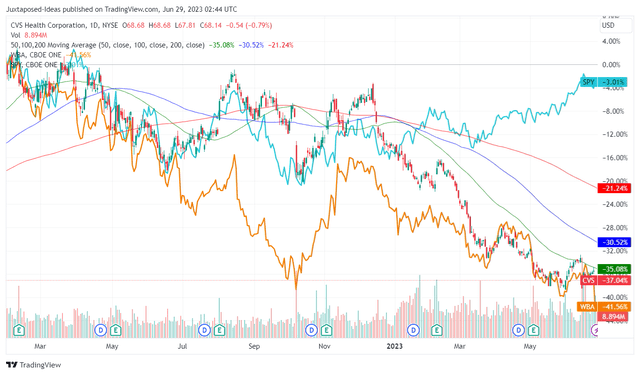
Given these developments, it is unsurprising that the CVS stock has been moderated thus far, declining drastically from its previous January 2022 peak. This is also worsened by Walgreens Boots’ (NASDAQ:WBA) lowered FY2023 guidance and pessimistic FY2024 commentary, with the latter retracing dramatically to 2010 lows after the recent earnings call.
Then again, since CVS has been somewhat spared from the bloodbath, with the stock only normalized to its previous 2019 levels, we believe Mr. Market remains convinced about its execution.
Its execution is only impacted by the expected normalization in the Medical Benefits Ratio [MBR] from the hyper-pandemic averages of 87.1% to the pre-pandemic level of 84.2% in FY2019, reduced COVID-19 contribution, and the peak recessionary fears moderating discretionary spending.
For now, CVS’ execution remains more than excellent in the face of the profitability headwinds, with the management raising its FY2023 revenue guidance to $350.6B (approximately +11% YoY), despite the underwhelming EPS guidance of $8.60 (approximately -4% YoY) at the midpoint.
With all the pessimism already baked in, we believe sentiments may lift once the Fed pivot by 2024, especially aided by the rationalization in its footprint to approximately 8.77K stores by the end of 2024 (-11.6% from FY2021 levels of 9.93K).
The CVS management continues to maintain its FY2024 adj EPS target of $9 and FY2025 of $10 as well, suggesting a CAGR of +4.79% from FY2022 levels of $8.69. As a result of the reiterated guidance, investors may remain patient and wait for its slow-but-steady turnaround.
So, Is CVS Stock A Buy, Sell, or Hold?
CVS 5Y Stock Price
Trading View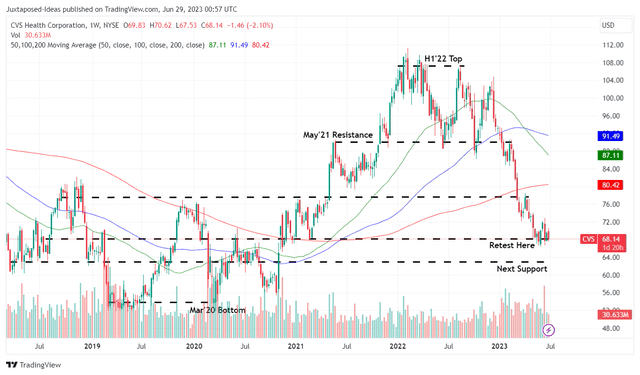
Therefore, despite the notable correction thus far, CVS investors who have yet to cash out may want to continue holding on.
In addition, the competent management has recognized the opportunity to repurchase shares at these depressed levels, by guiding a total diluted share count of approximately 1.293B (-2.2% YoY) by the end of 2023. This cadence will retire 30M shares and save the company approximately -$72.6M in annualized dividend payout, or the equivalent of -2.3%.
Based on the current CVS share price, we are also looking at an expanded forward dividend yield of 3.52%, compared to its 4Y average of 2.71% and sector median of 1.40%.
Its dividends remain safe as well, based on the projected FCF generation, an annualized payout sum of $3.12B for FY2023, and only $1.77B of debts due over the next twelve months. The cash/ short-term investments remain more than healthy as well, at $17.72B by the latest quarter (+12.7% QoQ/ +56.2% YoY), or approximately $12.12B by the next quarter (-31.6% QoQ/ -19.1% YoY) based on the $5.6B of cash utilization for the Oak Street acquisition.
With these optimistic factors well negating the narrowing profit margins, we are cautiously rating the CVS stock as a Buy here, especially due to the improved margin of safety to our price target of $105.60. This is based on the market analysts’ FY2025 adj EPS projection of $9.86 and its normalized pre-pandemic P/E valuation of 10.71x.
Credit: Source link