
Spencer Platt
The Health Care sector was one to generally avoid in 2023. Unless you were significantly overweight (no pun intended) in shares of Eli Lilly (LLY) and Novo Nordisk (NVO), it’s probable that you underperformed the S&P 500 given the Health Care Select Sector SPDR ETF’s (XLV) weak returns. Has the tide turned in favor of defensive Health Care equities? XLV has beaten SPY by about five percentage points just since mid-December.
I see more upside ahead in CVS Health (NYSE:CVS). Following guidance that was reiterated last week and with a new permanent CFO at the helm, the company appears undervalued to me while the technicals have turned more favorable.
Healthcare Stocks Spring Back to Life
StockCharts.com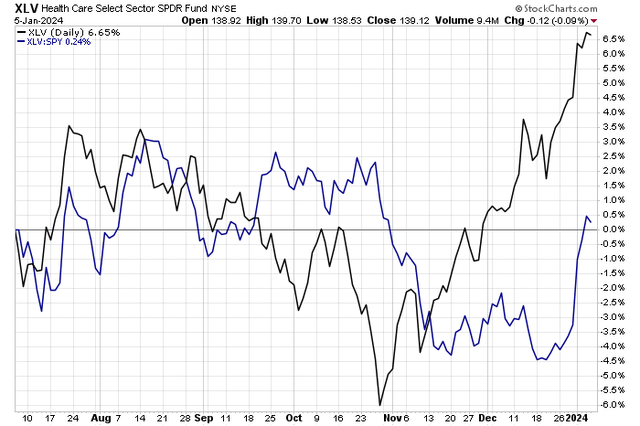
According to Bank of America Global Research, CVS Health Corporation provides health services in the US. It operates through Health Care Benefits, Pharmacy Services, and Retail/LTC segments and is among the largest Health Care companies in the country, providing retail, mail, and specialty pharmacy dispensing services and pharmacy benefits. It is one of the most vertically integrated publicly traded Health Care companies.
The Rhode Island-based $105 billion market cap Health Care Services industry company within the Health Care sector trades at a low 9.5 forward 12-month non-GAAP price-to-earnings ratio and pays an above-market 3.3% dividend yield as of January 5, 2024. Ahead of earnings in early February, the stock has a low implied volatility percentage of 22% while its short interest is modest at just 1.2%.
Back in November, CVS reported a strong Q3 report. Quarterly non-GAAP EPS verified at $2.21, topping the Wall Street consensus expectation of $2.13 while revenue of $90 billion, up nearly 11% from year-ago levels, beat by a whopping $1.6 billion. For its full-year guidance, the management team issued its adjusted EPS outlook of $8.50 to $8.70 vs. $8.75 consensus while confirming cash flow from operations in the $12.5 billion to $13.5 billion range. Shares wobbled following the report as segment-level performances were mixed. Its Health Services and Pharmacy & Consumer Wellness EBIT amounts were robust, but Healthcare Benefits ensured some softness due to a higher medical benefits ratio.
Then just last week, the management team reaffirmed its FY 2023 and FY 2024 guidance to be in the upper end of the $8.50 to $8.70 range for FY 2023. What was bullish was that it announced a $3 billion accelerated buyback program and appointed a permanent CFO. These signs of stability are encouraging, though risks from growing competition in the pharmacy benefits space remain along with opioid-related litigation risks.
On valuation, analysts at BofA see earnings falling just slightly this year before per-share profit growth returns in 2025. The current consensus forecast, per Seeking Alpha, reveals that 2024 EPS will fall by less than 1% following last year’s flat earnings growth. With sales advancing 2% this year and 6% in the out year, some operating leverage is expected by 2025.
Dividends, meanwhile, are forecast to rise to hold at $2.66 annually (a $0.665 quarterly payout comes on Thursday, February 1). With very low operating and GAAP earnings multiples, the stock is priced rather pessimistically. Moreover, CVS features a low EV/EBITDA ratio, several turns under the average of the S&P 500 while its free cash flow yield is very high.
CVS: Earnings, Valuation, Dividend, Free Cash Flow Forecasts
BofA Global Research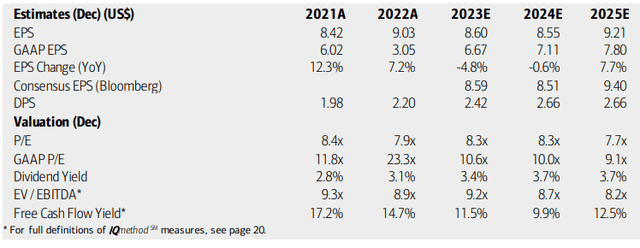
If we assume operating earnings per share of $8.70 over the next 12 months and apply the stock’s 5-year historical earnings multiple of 9.8 then CVS should trade near $85. That’s about what I figured in my previous analysis, but considering that the stock trades at a significant discount to its long-term average price-to-sales ratio, along with CVS having both a high dividend yield and solid free cash flow, there are upside risks to my valuation should earnings continue to come in strong – CVS has topped estimates in each of the last 12 reports.
CVS: Compelling Valuation Metrics
Seeking Alpha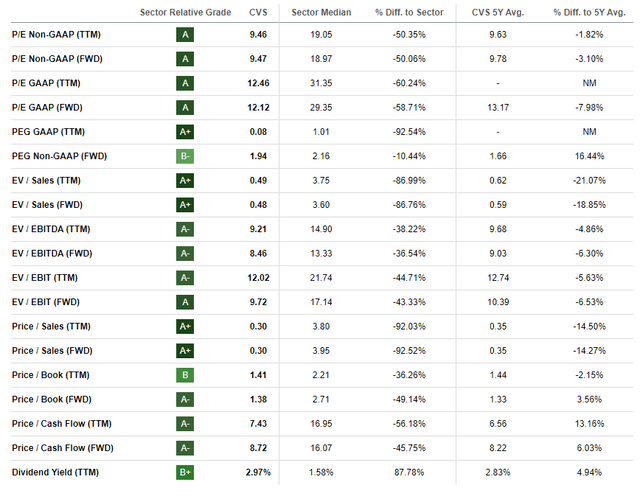
Compared to its peers, CVS features among the top valuation grades by Seeking Alpha, though recent growth trends have been weak. Still, with earnings rebound expected starting next year, there’s reason for optimism in terms of its valuation multiple going forward. Moreover, CVS features very strong absolute and relative profitability trends while its share-price momentum has become much healthier over the past several months – I will detail the technicals in detail later in the article. Finally, EPS revisions have been mixed, and I would like to see a faster turn in earnings momentum.
Competitor Analysis
Seeking Alpha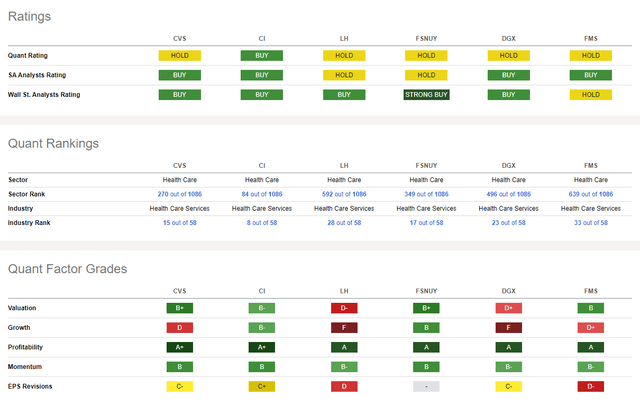
Looking ahead, corporate event data provided by Wall Street Horizon shows a confirmed Q4 2023 earnings date of Wednesday, February 7 BMO with a conference call immediately after the results hit the tape. You can listen live here. CVS also issues same-store sales within that report. Near-term, the management team is expected to present at one of the most important industry conferences of the year: the JP Morgan 42nd Annual Healthcare Conference 2024 from January 8 through 11. Both Karen S. Lynch, President, CEO, Thomas F. Cowhey, CFO are expected to speak.
Corporate Event Risk Calendar
Wall Street Horizon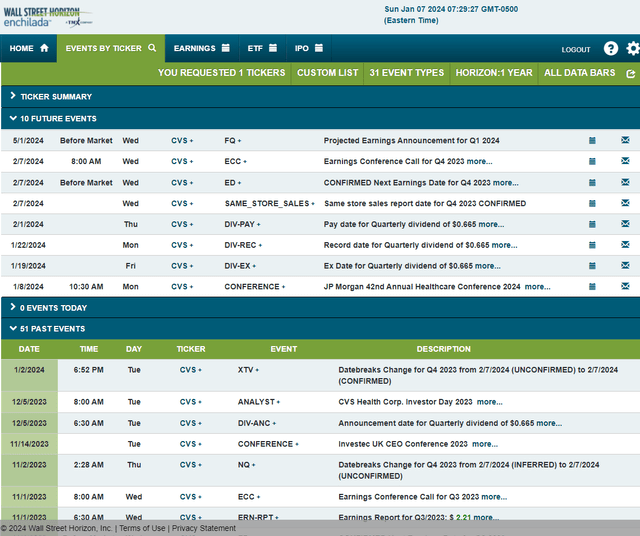
The Technical Take
Last year, I noted that the upper $60s was likely to be important support for CVS shares. Indeed, the bulls showed up around where we would expect. Notice in the chart below that CVS met buyers a few times above $64 in 2023. The really bullish move then came late in Q4. The stock jumped from below $70 to the mid-$70s in short order, rising above its long-term 200-day moving average for the first time since late 2022. The surge came on an uptick in volume, too. Then, just a few sessions ago, the shorter-term 50-day moving average rallied through the 200dma in what technicians deem a bullish golden cross pattern.
Also, take a look at where the stock may go next following a breakout through the mid-$70s. With shares at 10-month highs, helping to lead the S&P 500 since October, I see resistance in the upper $80s. There is actually not a whole lot of volume by price from here to there, so squeaking out another 10% upside seems doable. Support is seen at former resistance, which would be in the $77 to $78 zone. For now, with the RSI momentum oscillator at very high marks, a near-term consolidation would make sense, but that would be a mere pause in the trend of larger degree, which appears higher today.
Overall, CVS held support nicely last year and now appears as a market leader.
CVS: Downtrend Reversed, Shares Rally Through Key Resistance, $88 Next Stop
StockCharts.com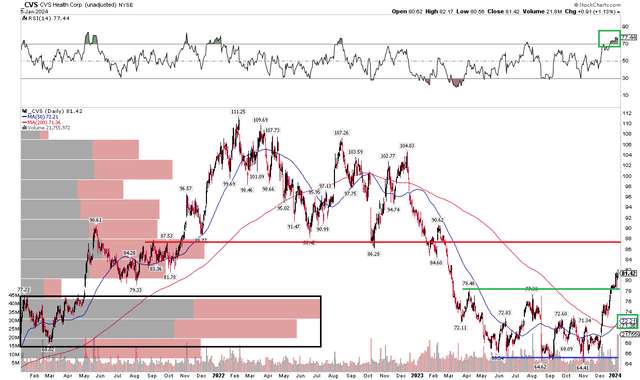
The Bottom Line
I reiterate my buy rating on CVS Health. I see shares as still undervalued following a significant jump in its stock price since late last year.
Credit: Source link