

Pgiam/iStock via Getty Images
Three years ago, I recommended buying Cross Timbers Royalty Trust (NYSE:CRT) for its 100% upside potential within the following two years amid an expected recovery from the pandemic. Indeed, the stock doubled in just 15 months. I then stated that Cross Timbers Royalty Trust had become less attractive but the stock doubled one more time, primarily thanks to the rally of oil and gas prices triggered by the war in Ukraine, which no-one could have predicted. Since it peaked at $30 earlier this year, the stock has declined 30%. This may lead some investors to consider the oil and gas trust a bargain at its current level. However, in this article, I will analyze why the stock is unattractive from a long-term perspective.
Business overview
Cross Timbers Royalty Trust is an oil and gas trust that has a 90% net profit interest in some properties in Texas, Oklahoma and New Mexico and a 75% net profit interest in some working interest properties in Texas and Oklahoma. A working interest asset is an asset in which the trust pays for all the underlying development and production costs. In sharp contrast to the well-known oil and gas majors, such as Exxon Mobil (XOM) and Chevron (CVX), Cross Timbers Royalty Trust has static properties, i.e., it cannot expand its operations into new properties.
Cross Timbers Royalty Trust has greatly benefited from the Ukrainian crisis. Due to the invasion of Russia in Ukraine, the U.S. and Europe imposed strict sanctions on Russia in early 2022. Before the sanctions, Russia was producing approximately 10% of global oil output and more than one-third of natural gas consumed in Europe. It is thus easy to understand why the sanctions triggered a steep rally of the prices of oil and gas, to 13-year highs.
As a pure upstream company, Cross Timbers Royalty Trust was ideally positioned to benefit from the rally of the prices of oil and gas. Thanks to this rally, the trust nearly doubled its annual distribution, from $1.10 in 2021 to an 8-year high of $1.96 in 2022. Even better, as there is a lag between the benchmark prices of oil and gas and the realized prices of the trust, the stock has offered total distributions of $2.39 over the last 12 months. This level of distributions corresponds to an annual distribution yield of 11.2%.
However, it is important to realize that the tailwind from the Ukrainian crisis has abated this year and is likely to abate even more in the upcoming years. First of all, the price of natural gas has plunged this year, mostly due to an abnormally warm winter in both the U.S. and Europe. In addition, the price of oil has plunged 45% off its peak early last year.
After the initial shock from the aforementioned sanctions, Russia found ways to increase its crude oil sales, mostly by boosting its sales to some major consumers in Asia, such as China. Moreover, the above mentioned rally of oil and gas prices caused a fierce global energy crisis last year, as numerous households could not afford to pay their energy bills. Consequently, most countries began to invest in renewable energy projects in order to drastically reduce their dependence on fossil fuels. A record number of clean energy projects is underway right now. When all the projects begin to generate energy, they are likely to take their toll on the prices of oil and gas. This is an important risk factor to consider before purchasing an oil and gas stock, particularly given the dramatic cyclicality of the oil and gas industry and the fact that this sector seems to have passed its peak for good since early last year. Given the high cyclicality of the oil and gas industry, investors should make sure they understand the phase of the cycle of the industry before investing in a company of this sector.
Distribution
As mentioned above, Cross Timbers Royalty Trust has offered total distributions of $2.39 over the last 12 months. These distributions correspond to an annualized yield of 11.2%. However, it is critical to realize that a great part of these distributions has resulted from exceptionally high prices of oil and gas. The sharp correction of commodity prices this year is likely to take its toll on the distributions of the trust.
Indeed, the trust reduced its monthly distribution by 58% in June, from $0.1851 in May to $0.0770. The monthly distribution of June corresponds to an annual distribution of $0.9240, which implies an annual yield of only 4.3%. It is also important to note that the average annual distribution of Cross Timbers Royalty Trust during 2016-2019, when oil and gas prices were normal (before the plunge due to the pandemic and the subsequent rally thanks to the Ukrainian crisis), was $1.09. This level of distributions corresponds to an annualized yield of 5.1% at the current stock price. Such a yield is exceptionally low when compared to the historical yield of this trust.
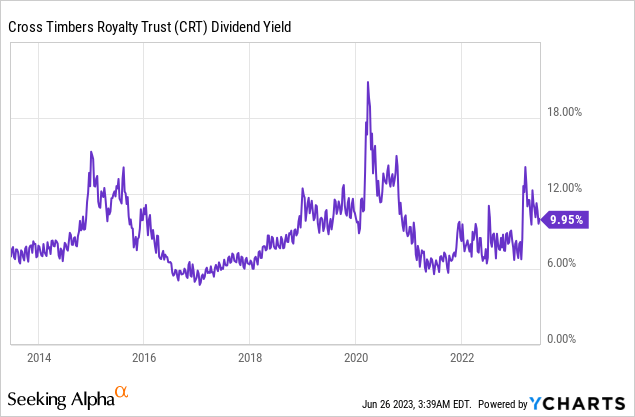
Indeed, Cross Timbers Royalty Trust has a high level of inherent risk and hence the market has always demanded a high distribution yield from the stock in order to be compensated for its elevated risk. As the trust cannot expand into new properties, it suffers from the natural decay of its producing fields in the long run. This is a strong headwind for the returns of this stock. To be sure, while the prices of oil and gas soared to 13-year highs last year, the distribution of the trust in 2022 was 26% lower than its distribution in 2014. This divergence was caused primarily by a 16% decrease in the production of natural gas of the trust over the 8-year period as well as increased operating expenses.
Overall, given the sharp decrease in the distribution of Cross Timbers Royalty Trust in June, the headwind from the record number of clean energy projects and the well-known cyclicality of oil and gas prices, it is prudent to expect lower oil prices at some point in the next few years. If this proves correct, Cross Timbers Royalty Trust will probably have significant downside risk, as its current distribution yield (based on its last monthly distribution) is already much lower than its historical average yield.
Upside risk
While the odds do not favor an investment in Cross Timbers Royalty Trust right now, a scenario of higher oil prices in the future cannot be excluded. If the global economy recovers strongly from its latest slowdown and some fast-growing countries, such as China and India, greatly increase their consumption of oil, the price of oil may experience a rally at some point in the upcoming years, particularly if there is a new geopolitical catalyst. However, the odds do not favor such a scenario right now, especially given the unprecedented pace of transition of nearly all countries from fossil fuels to renewable energy sources.
Final thoughts
Just like most oil and gas stocks, Cross Timbers Royalty Trust has offered excessive returns over the last three years. During this period, the stock has essentially tripled whereas the S&P 500 has rallied 44%. However, oil and gas stocks tend to underperform the S&P 500 over the long run. This is true over the last decade, as Cross Timbers Royalty Trust has declined 21% whereas the S&P 500 has rallied 170% over this period. Given the high cyclicality of the oil and gas industry, the long-term decline of the production of Cross Timbers Royalty Trust and its low forward distribution yield, the trust is not attractive right now.
Credit: Source link