

Suchada Tansirimas/iStock via Getty Images
Inflation is clearly moving in the Fed’s favor. November CPI and PPI data were largely sanguine, and Friday’s key PCE report, the Fed’s preferred inflation gauge, is poised to print a rate that is much lower than what was seen just a few months ago. In a note to clients earlier this week, Goldman Sachs pointed out that month-on-month annualized core price rises for countries that experienced large and unwanted inflation is now close to 1%. For the US, plug in real-time housing and rent prices, and true core inflation is likewise hardly a concern as we head into 2024.
Core Inflation Trends Much Better
Goldman Sachs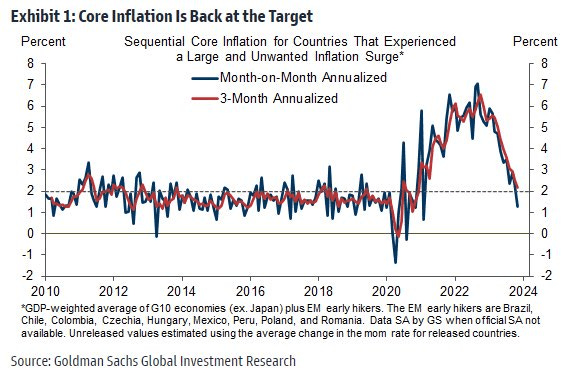
US Core PCE Q/Q 2.0% For Q3 2023
Trading Economics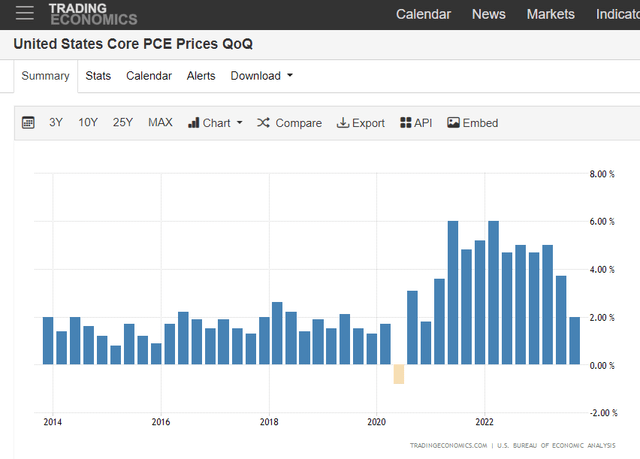
There was more good news reported this week. The Conference Board’s Consumer Confidence Index rose by the most since 2021 amid falling gasoline prices, rising stocks, easing mortgage rates, and a general hopeful cheer as the holiday season reaches its climax. It’s more evidence of an “immaculate disinflation” soft-landing narrative in which inflation ebbs while growth flows. Soft data, like the confidence survey, has been a weak indicator lately, but it is a positive, nevertheless.
Consumers Turn More Upbeat Heading Into the Holidays
The Conference Board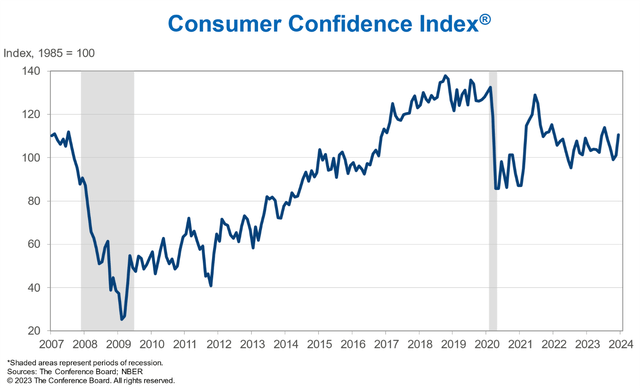
We can dig further into the “feelings” focus. CEO Confidence, also reported by The Conference Board, ticked lower in Q4 compared to Q3. Now, this could be due to a more troubled macroeconomic landscape amid higher borrowing costs compared to year-ago levels and as profitability trends remain a question mark (though the S&P 500 YoY EPS growth rate is back on the upswing after a protracted earnings recession in 2022 and early 2023).
I would like to see CEO confidence increase – that would help support the idea that more corporate investment could be in the works, as well as more aggressive hiring and capex spending plans.
CEO Confidence Softens in Q4
The Conference Board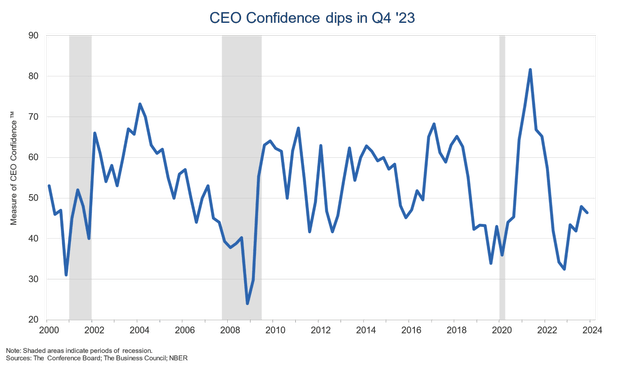
So Long, Earnings Recession!
Goldman Sachs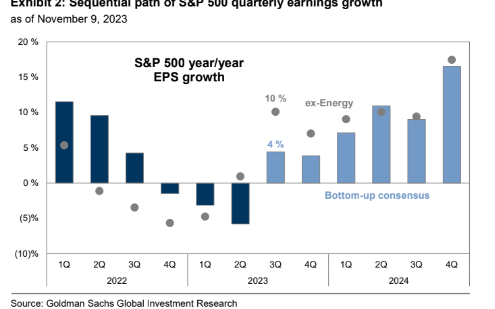
Speaking of capex, the outlook is downright bullish. Broad themes like outdated equipment and reshoring are tailwinds. BofA’s outlook, illustrated below, shows that domestic capex spending could approach $1 trillion by 2025 (compared to $747 billion this year). In my view, this could be the chart that truly sparks the so-called “roaring 20s” mantra.
Roaring 20s? Capex Forecast Bullish.
BofA Global Research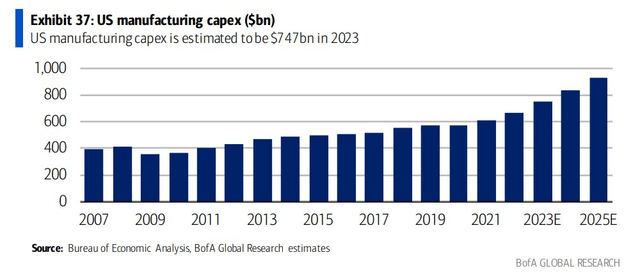
Now, let’s turn our attention to price action and what areas could benefit from the growth in capex, albeit with easing inflationary pressures. Take a look at the 6-month ETF performance heat map below. It shows that among all ETFs, the SPDR Metals & Mining ETF (XME) has outperformed the overall stock market over the back half of this year. Investors are picking up on the reality that some cyclical stocks are in a better position to benefit from macro factors.
6-Month ETF Performance Heat Map: Metals & Mining Stocks Muster Gains
Finviz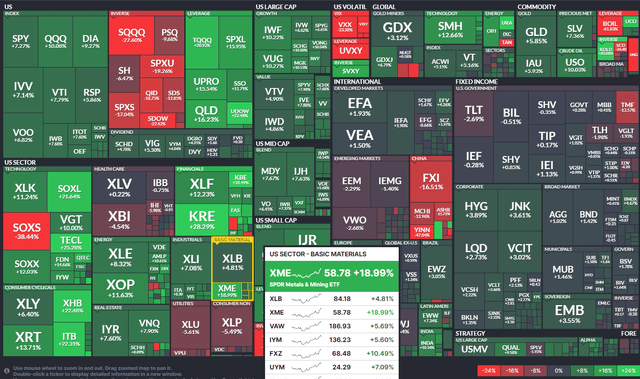
Now let’s home in on the most crucial commodity for global industrial activity: copper. I first reviewed the United States Copper Index Fund, LP ETF (NYSEARCA:CPER) in June last year – when inflation was at its zenith. I was neutral on the industrial metal, expecting a turn lower in geopolitical tensions and soothing consumer prices to possibly ding the metals, including copper. It turned out that copper would hold its own, rallying at the end of 2022 before sputtering for much of this year.
Seasonally, according to data from Equity Clock, copper tends to rally sharply versus the S&P 500 now through February before a sideways relative performance has historically ensued for the balance of the year. So, adding some copper to your portfolio now could help from not only a diversification point of view but also to help juice returns potentially.
Copper vs S&P 500 Seasonality: Bullish Late Dec-Early March
Equity Clock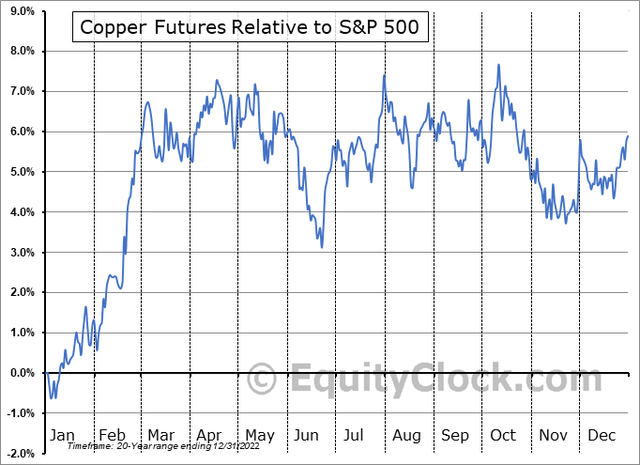
For background, CPER is an ETF that seeks to track daily changes in near-dated copper futures, according to the issuer. It currently holds December 2023, March 2024, and May 2024 copper futures contracts and allows investors a cost-effective way to access this part of the commodity market. Its annual expense ratio is high at 0.97% and does not pay a dividend.
The Technical Take
When performing technical analysis, I prefer to use the spot price of copper. Notice in the chart below that copper appears to have broken out from a steep downtrend resistance line dating back to its March 2022 peak above $5. After crashing to a summer 2022 low just above $3, the industrial metal rallied to $4.35 by the start of this year.
It has been tough sledding for the copper bulls in 2023, though, with the continuous prompt-month falling throughout Q1, Q2, and Q3, eventually hitting a double-bottom low of $3.52 just a handful of weeks ago. Now, with copper above its 200-day moving average and through the downtrend line, a new upswing may be getting underway. I see the potential for a move up to the early-year peak over the coming months but would be concerned if copper fell under $3.50 support.
Copper: Bullish Downtrend Breakout, RSI Momentum Trending Higher
Stockcharts.com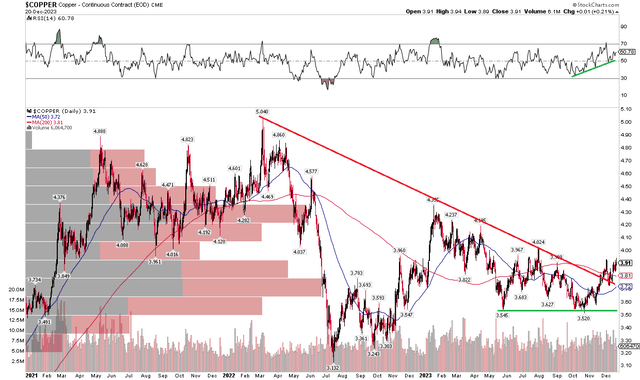
The Bottom Line
Inflation looks to be a less pivotal macro risk in 2024, and eyes may now turn to the growth side of the ledger. With bullish long-term capex trends and a key technical breakout in copper futures, I assert that owning the CPER ETF could be a decent play heading into the new year.
Credit: Source link