
JHVEPhoto/iStock Editorial via Getty Images
Introduction
The Houston-based ConocoPhillips (NYSE:COP) released its second-quarter 2023 results on August 3, 2022.
COP is one of the world’s largest independent oil & gas producers, with 58.9% of oil equivalent production coming from the lower 48, especially three prolific basins: Permian, Eagle Ford, and Bakken.
COP 2Q23 Production Oil Equivalent per Segment in the Lower48 (Fun Trading)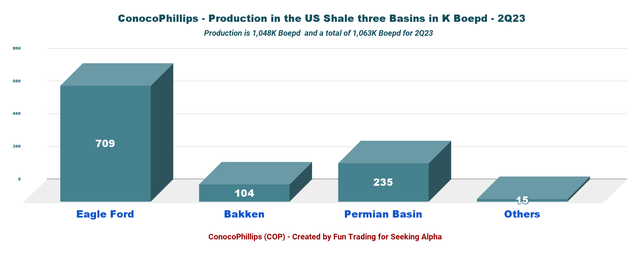
Note: This article updates my article published on June 14, 2023. I have followed COP on Seeking Alpha since March 2017.
ConocoPhillips reported second-quarter 2023 adjusted earnings per share of $1.84, below analysts’ expectations. A decrease from an adjusted profit of $3.91 per share a year ago.
ConocoPhillips’ quarterly revenues were $12,884 million in the second quarter, significantly lower than the $21,989 million realized a year ago.
The company delivered a record oil equivalent production of 1,805K Boepd in 2Q23 compared with 1,692K Boepd in 2Q22, an increase of 6.7%.
CEO Ryan Lance noted in the conference call:
While commodity prices were volatile, ConocoPhillips continued to deliver strong underlying performance. Once again, we had record global and Lower 48 production and we raised our full year production guidance for the second straight quarter. This was achieved through continued capital efficiency improvements as the midpoint of our full year capital guidance remains unchanged.
On May 26, 2023, COP announced that it is exercising its preemption right to purchase the remaining 50% interest in Surmont from TotalEnergies EP Canada Ltd. for about $3 billion. ConocoPhillips currently holds a 50% interest as the operator of Surmont and will own 100% upon closing.
1 – Stock Performance
1.1 – The company is a long-term oil investment comparable to my US oil supermajors’ group, such as Exxon Mobil (XOM) or Chevron (CVX). As we can see in the chart below, COP is down over 11% YoY.

ConocoPhillips – 2Q22 to 2Q23: Financials And Trend – The Raw Numbers
| ConocoPhillips | 2Q22 | 3Q22 | 4Q22 | 1Q23 | 2Q23 |
| Oil Revenues in $ Billion | 21.16 | 21.01 | 18.56 | 14.81 | 12.35 |
| Total Revenues in $ Billion | 21.99 | 21.61 | 19.26 | 15.52 | 12.88 |
| Net income in $ Billion | 5.15 | 4.53 | 3.25 | 2.92 | 2.23 |
| EBITDA $ Billion | 9.74 | 9.57 | 7.48 | 6.76 | 5.62 |
| EPS diluted in $/share | 3.96 | 3.55 | 2.61 | 2.38 | 1.84 |
| Cash from operations in $ Billion | 7.91 | 8.74 | 6.59 | 5.40 | 3.85 |
| Capital Expenditure in $ Billion | 1.97 | 2.50 | 2.53 | 2.90 | 2.92 |
| Free Cash Flow in $ billion | 5.95 | 6.24 | 4.06 | 2.51 | 0.93 |
| Total cash $ Billion | 8.18 | 10.42 | 9.24 | 8.61 | 6.82 |
| Total debt in $ Billion | 16.97 | 16.96 | 16.64 | 16.58 | 16.44 |
| Dividend per share in $ | 0.46+1.40 | 0.51+0.70 | 0.60+0.51 | 0.60+0.51 | 0.60+0.51 |
| Shares outstanding (diluted) in Billion | 1.296 | 1.269 | 1.243 | 1.223 | 1.210 |
Sources: Company data and Fun Trading Analysis
Analysis: Balance sheet and Upstream Production
1 – Quarterly revenues and other income were $12,884 billion (oil revenues were $12,351 million) in 2Q23
COP Quarterly Revenue History (Fun Trading) ConocoPhillips posted total revenue of $12,884 million for the second quarter, down from the $21,989 million made in the same quarter last year. The chart shows the previous eight years of revenue.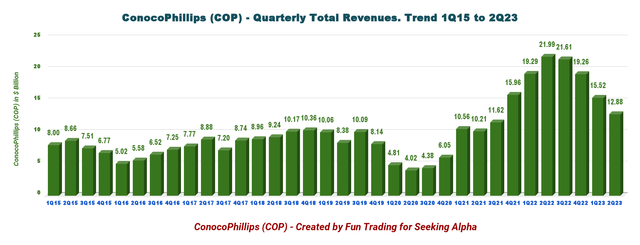
Net income was $2,232 million in 2Q23 or $1.84 per diluted share versus $5,145 million the previous year or $3.96 per diluted share.
ConocoPhillips’ second-quarter total expenses rose to $9,522 million from $14,334 million in the corresponding period 2022.
The lower-than-expected quarterly earnings were due to lower commodity prices partially counterbalanced by record Oil Equivalent production reaching 1,805K Boepd.
Second-quarter CapEx was $2.923 billion, which included $624 million for long-cycle projects, compared with $1.968 billion in 2Q22.
Second quarter Cash flow from operations was $4.7 billion at an average WTI price of $74.19 per barrel.
The CFO includes a $405 million distribution from the 47.5% owned APLNG, a large Australian LNG resource.
A reminder: in March 2023, COP acquired a 30% direct equity investment in PALNG, a joint venture to develop a large-scale LNG facility. On June 30, 2023, the carrying value of our equity method investment in PALNG was approximately $0.7 billion.
2 – Free cash flow (not including divestitures) was $931 million in 2Q23
COP Quarterly Free Cash Flow History (Fun Trading) Note: The generic free cash flow is the cash for operating activities minus CapEx.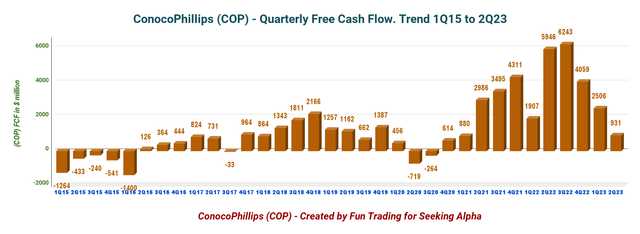
- The trailing 12-month free cash flow for ConocoPhillips is $12,739 million. COP recorded a second-quarter FCF of $931 million.
- The quarterly dividend is $1.11* per share yearly or a yield of 3.73%.
During 2Q23, ConocoPhillips distributed $2.7 billion to shareholders through a three-tier return of capital framework, including $1.4 billion through share repurchases and $1.3 billion through the ordinary dividend and VROC.
* ConocoPhillips announced a second-quarter dividend of $0.60 per share and a variable return of cash (“VROC”) payment of $0.51 per share.
3 – Oil production was 1,805K Boepd in 2Q23
COP Quarterly Production History (Fun Trading) Production jumped to a new record of 1,805K Boepd, up from 1,692K Boepd the same quarter a year ago. Of the total output, 51.6% was crude oil. The increase in production this quarter was primarily due to the rising production in the Lower 48.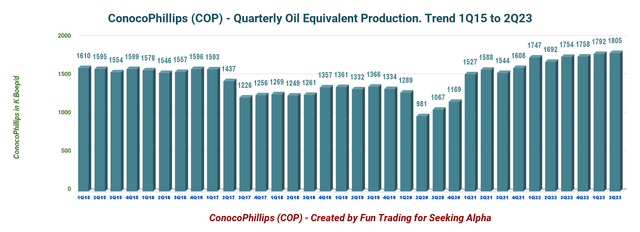
3.1 – Details per commodity: 51.6% was crude oil
COP 2Q23 Production per Segment (Fun Trading)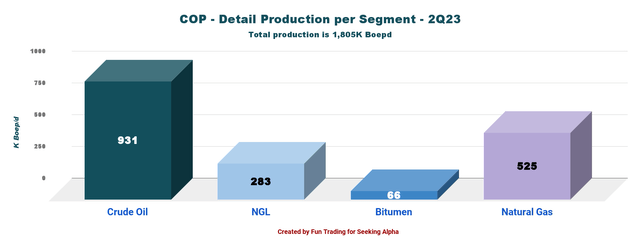
3.2 – Global average oil equivalent prices realized by ConocoPhillips (crude oil, natural gas, NGL, etc.)
The global average oil equivalent price decreased significantly yearly, from $88.57 to $54.50.
COP Quarterly Oil Price History (Fun Trading)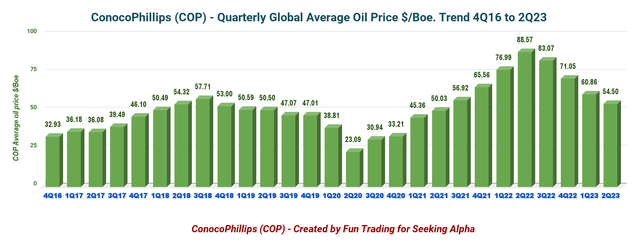
- The average crude oil price for the second quarter was $74.19 per barrel, significantly decreasing from the year-ago realization of $111.50.
- Realized natural gas liquids price was $20.72 per barrel, from the year-ago quarter’s $43.26.
- The average natural gas price for second-quarter 2023 was $5.04 per thousand cubic feet, down from the year-ago period’s $10.15.
3.3 – Production in Boepd per region. The Lower 48 is the most significant part, with 57.8%
COP 2Q23 Production per Region (Fun Trading)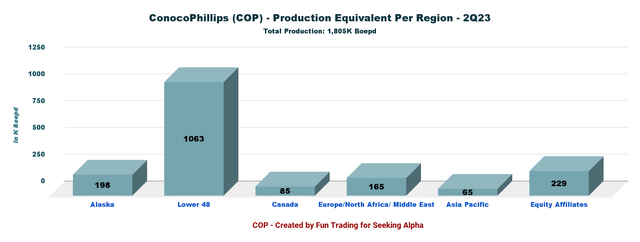
3.4 – Lower 48 production details
Production in the Lower 48 represents 58.9% or 1,063K Boepd of the total output. The Lower 48 comprises the three US shale basins (Eagle Ford, Bakken, Permian Basin) and the Gulf of Mexico production, but not Alaska. However, the production of the three basins is 1,048K Boepd.
COP 2Q23 Production detail Lower 48 (Fun Trading)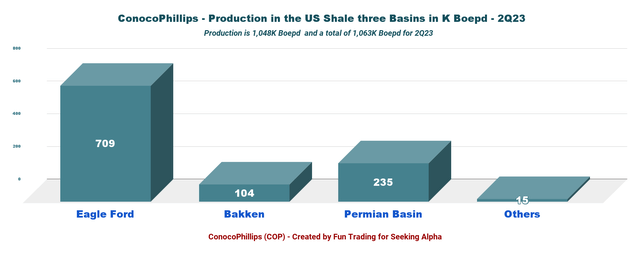
The Permian Basin is the most prolific for the company and represents 39.3% of the total output.
Also, the company is expanding its LNG footprint with the Port Arthur LNG which is a natural gas liquefaction and export terminal in Southeast Texas with direct access to the Gulf of Mexico which will be launched in 2027.
CFO William Bullock said in the conference call:
Now through the first half, we have now funded $700 million for Port Arthur LNG of the planned $1.1 billion for the year, which we expect to lead to a step down in overall capital in the second half. We also expect to see a step down in Lower 48 capital in the second half of the year. And as a result, we have narrowed our full year capital guidance range to $10.8 billion to $11.2 billion, with no change to the midpoint.
4 – Guidance 2023
ConocoPhillips expects production for the 3Q23 at 1.78 to 1.82M Boepd. This year’s new production guidance is 1.80 to 1.81M Boepd.
The company expects its 2023 CapEx to be $10.8-$11.2 billion.
5 – Net Debt is now $9.629 billion in 2Q23
COP Quarterly Cash versus Debt History (Fun Trading) Net debt is about $9.629 billion, with total cash of $6.815 billion.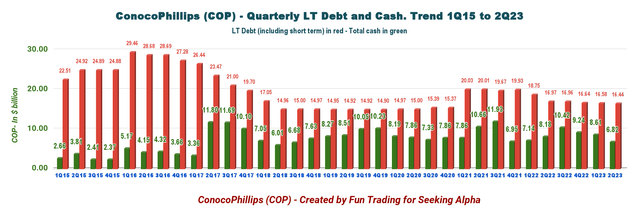
On May 23, 2023, COP issued $1.1 billion in 5.3% Notes due 2053. Subsequently, the company repaid $1,133 million of three notes due 2024-2025.
Furthermore, COP’s revolving credit facility provides a total borrowing capacity of $5.5 billion with an expiration date of February 2027.
Technical Analysis And Commentary
COP TA Chart (Fun Trading StockCharts)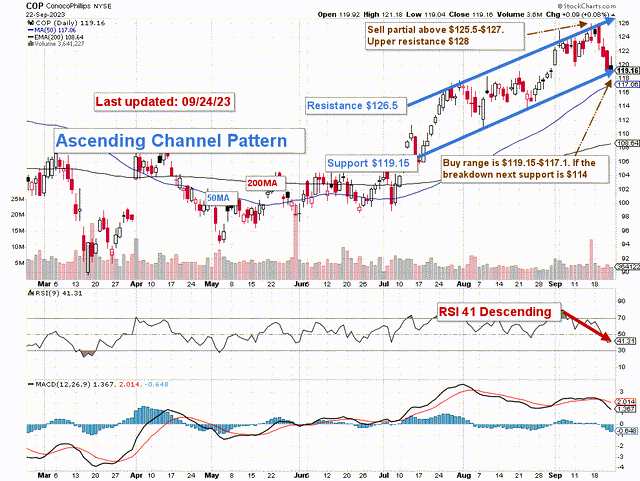
Note: The chart is adjusted for the dividend.
COP forms an ascending channel Pattern, with resistance at $126.5 and support at $119.15. RSI 41 indicates we may break down support and reach the lower support at below $115.
Ascending channel patterns are generally short-term bullish, moving higher within an ascending range, but these patterns usually form within longer-term downtrends as continuation patterns. Hence, I expect MPC to drop soon and potentially break down support.
Oil prices have increased significantly since July 2023 and are now up over 3% YoY. Unfortunately, natural gas is still nearly 60% down YoY.
COP 1-Year Chart Brent and NG Prices (Fun Trading StockCharts)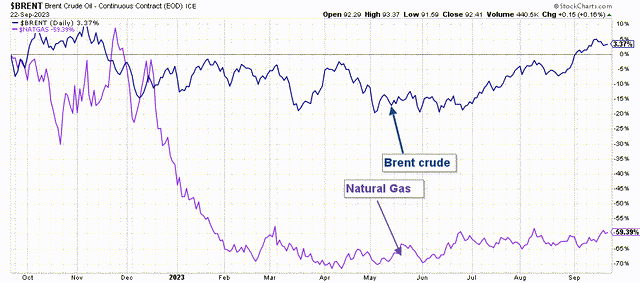
The mid-term projection for oil and NG is difficult to speculate for H2 2023, but I am less optimistic now. Oil prices are nearing the end of their bull run. I see only a fragile stabilization of the NG prices.
Thus, I think selling 30-40% (Trading LIFO) between $125.5 and $127 with potential higher resistance at $128 and waiting to buy between $119.15 and $117.1 with possible lower support at $114 to consider adding again is a wise winning strategy.
Warning: The TA chart must be updated frequently to be relevant. It is what I am doing in my stock tracker. The chart above has a possible validity of about a week. Remember, the TA chart is a tool only to help you adopt the right strategy. It is not a way to foresee the future. No one and nothing can.
Credit: Source link