
Andrii Dodonov
CLOs are not just a hedge against rising rates. They also have historically provided higher levels of income for a lower level of risk – making a clear case for a strategic allocation.
Investors have poured approximately $110 billion into long-term “core” bond categories this year after pulling $80 billion last year as rates rose.1
Adding duration risk likely appeared attractive to those who expected that Fed rate cuts sometime this year may also result in lower long-term bond yields, or at least to lock in yields that were high relative to what we’ve experienced in the last few years.
These expectations, so far, have not played out. The Fed has maintained its aggressive stance and continues to indicate no intention to reduce the Fed funds rate this year, while the 10-year U.S. Treasury yield recently hit its highest level since 2007.
From a yield perspective, the best opportunity has continued to be at the short end of the curve, and we expect this to continue amid a “higher for longer” rate environment.
Collateralized loan obligation (CLO) investors do not take interest rate duration risk, and therefore do not get paid for it. However, CLOs have performed very well this year compared to other fixed income asset classes because of the high carry they have provided, which is driven by both high short-term rates as well as spread levels that are above their historical average.
The latter point is notable, because other areas of the credit market continue to provide compensation for credit risk that is at or below historical averages, despite widespread expectations of some degree of an economic slowdown. The current high yield on fixed-rate corporate bonds, therefore, has been driven by higher risk-free interest rates.
Although overall yields matter greatly, by providing higher levels of income and providing a cushion against still-higher rates or spread widening (a particular concern right now, in our opinion), investors need to consider whether the compensation they are getting is adequate for the risk they are taking.
Although investors in long-term corporates, for example, can benefit from declining interest rates, that would simply reflect movements in the Treasury market, leaving investors exposed to a potential decline in credit quality which current spread levels are not compensating them for. Is there a better way to express a view on duration?
Although we do not necessarily believe now is the time to add duration to a portfolio, and there are reasons to believe long-term rates can continue to climb, many investors may disagree.
More broadly, we believe income investors can benefit from a portfolio that provides a diversified income stream that provides an attractive return relative to the degree of risk taken.
As we have written about previously, CLOs are not simply a hedge against rising rates, although like all floating rate asset classes, investors have benefited in the current environment.
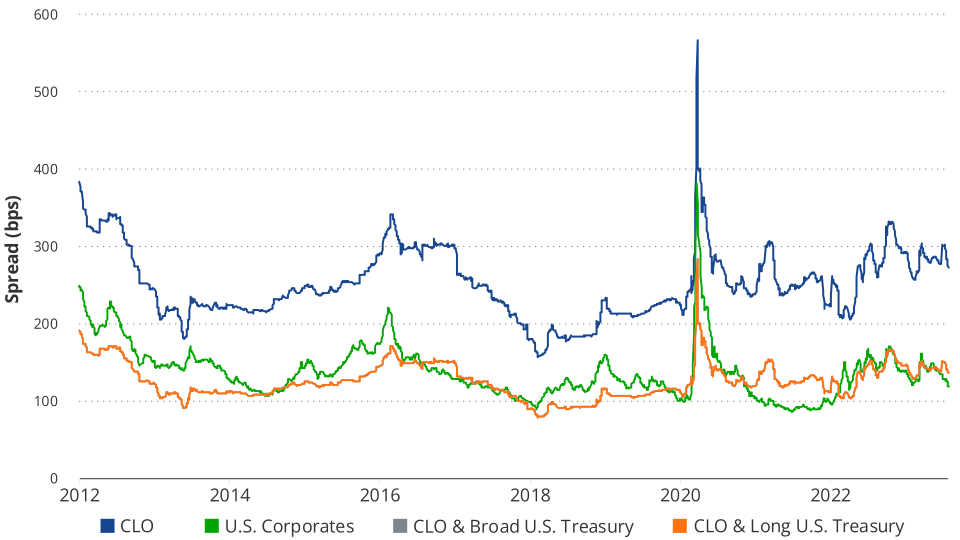
Because they provide higher spreads than similarly-rated corporates and provide built-in risk protections, they have historically provided higher levels of income for a lower level of risk.
As a result, we believe investors should consider a strategic position in CLOs within a core bond portfolio – not just in times of rising interest rates.
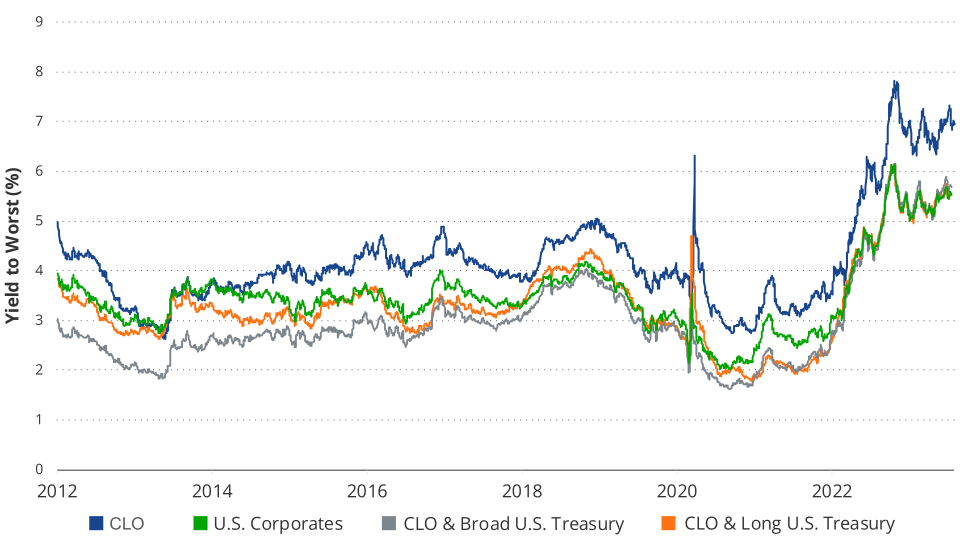
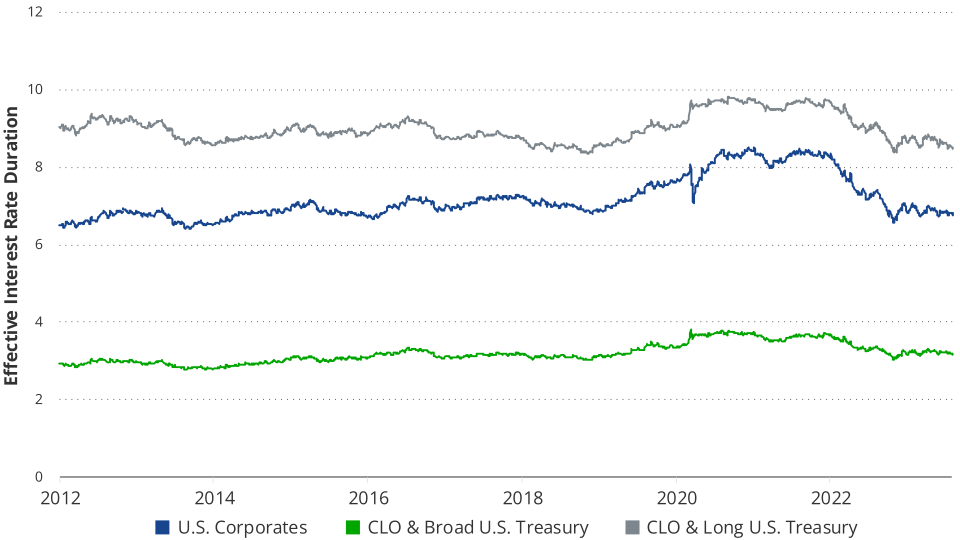
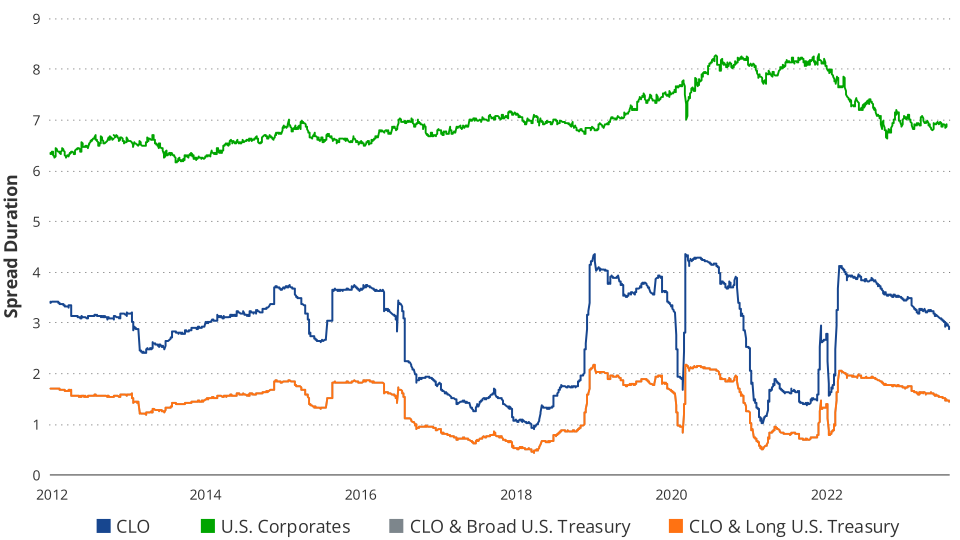
Below we illustrate the yield, spread, and duration profiles of CLOs, investment grade corporate bonds, and an equally weighted average of CLOs and U.S. Treasuries of various durations. We use indices to represent these broad asset classes, however investors cannot invest directly in an index. Our main takeaways are below:
- The overall yield CLOs provided has historically been significantly greater than U.S. corporates (due to their higher spread).
- The average yield of CLOs and broad U.S. Treasuries together currently provides an overall yield approximately in line with U.S. Corporates. Historically, a 50% weight to long-term Treasuries and CLOs exhibited a higher yield than U.S. Corporates, although with higher interest rate duration.
- An equal weight to CLOs and broad U.S. Treasuries has a lower interest rate duration than U.S. Corporates, and this has been true historically because CLOs do not have price sensitivity to the level of interest rates.
- Although CLOs do not have any meaningful interest rate duration, they are sensitive to changes in credit spreads. Given that the yield advantage of CLOs is driven by their high spread, this is important to remember. However, the sensitivity to spreads, as measured by spread duration, is lower than U.S. Corporates. An equal weight to CLOs and U.S. Treasuries also has a lower spread duration to U.S. Corporates (the spread duration of an equal weight to broad and long-term U.S. Treasuries is the same, given that the spread sensitivity is completely driven by CLOs).
- CLOs have exhibited less volatility and a lower drawdown historically, indicating that interest rates have been the primary risk drivers of fixed rate bonds over the past decade. The CLO and Treasury combinations have performed better than U.S. Corporates over the past decade from a risk perspective, although relative returns depend on the degree of duration risk taken. CLOs by themselves, however, exhibited the most favorable returns from both an absolute and risk-adjusted perspective.
Yield to Worst
Spread
Interest Rate Duration
Spread Duration
| Annual Returns (%) | 10 Yr Risk | ||||||
| 1 Yr | 3 Yrs | 5 Yrs | 10 Yrs | Std Dev | Sharpe | Max Drawdown | |
| CLO | 8.6 | 4.1 | 3.4 | 3.2 | 3.7 | 0.6 | (8.7) |
| Broad U.S. Treasury | (4.4) | (5.5) | 0.4 | 1.0 | 4.6 | – | (18.4) |
| Long U.S. Treasury | (13.0) | (14.4) | (1.4) | 1.7 | 12.4 | 0.2 | (41.3) |
| U.S. Corporates | (1.1) | (4.1) | 1.8 | 2.6 | 6.2 | 0.3 | (20.1) |
| CLO and Broad U.S. Treasury | 2.0 | (0.7) | 2.0 | 2.1 | 2.7 | 0.4 | (9.0) |
| CLO & Long U.S. Treasury | (2.4) | (5.4) | 1.3 | 2.7 | 6.3 | 0.3 | (21.6) |
Source: J.P. Morgan and ICE as of 7/31/2023. CLO represented by J.P. Morgan CLO Index; Corporate represented by ICE BofA US Corporate Index; Broad US Treasury represented by ICE BofA US Treasury Index; Long US Treasury represented by ICE BofA 20+ Year US Treasury Index; CLO & UST represented by 50% J.P. Morgan CLO Index and 50% ICE BofA US Treasury Index; CLO & UST represented by 50% J.P. Morgan CLO Index and 50% ICE BofA 20+ Year US Treasury Index. Past performance is no guarantee of future results.
Duration and credit risk are the two primary drivers of risk and return in fixed income. This is why we highlighted the CLO and U.S. Treasury combinations compared to investment grade corporate bonds, as they have similar levels of credit risk as well as interest rate duration exposure.
CLOs can play a role in a core bond portfolio because of their yield, spread and duration profile, and although particularly attractive right now, we believe this is true in any rate environment.
In contrast, the current level of spreads are currently not attractive in the broad investment grade and high yield markets relative to historical averages.
However, we believe that there is still a case for these asset classes in a long-term portfolio due to their currently high overall yields and from a diversification perspective, as Treasuries, high yield markets, investment corporates, and CLOs all behave differently in different market environments.
As such, we believe an income portfolio should include diversified sources of risk and return, and that CLOs deserve a strategic allocation through varying rate and credit cycles.
Disclosures
1 Source: Morningstar Direct as of 7/31/2023. Represents net flows to the following Morningstar categories: Intermediate Core Bonds, Intermediate Core Plus Bonds, Intermediate Government, Long Government, Long-Term Bond, and Corporate Bond.
Index descriptions:
J.P. Morgan CLO Index tracks U.S. dollar denominated broadly-syndicated, arbitrage CLOs.
ICE BofA US Corporate Index tracks the performance of U.S. dollar denominated investment grade corporate debt publicly issued in the U.S. domestic market.
ICE BofA US Treasury Index tracks the performance of U.S. dollar denominated sovereign debt publicly issued by the U.S. government in its domestic market.
ICE BofA 20+ Year US Treasury Index is a subset of ICE BofA US Treasury Index including all securities with a remaining term to final maturity greater than or equal to 20 years.
Please note that VanEck may offer investments products that invest in the asset class(es) or industries included in this blog.
This is not an offer to buy or sell, or a recommendation to buy or sell any of the securities, financial instruments or digital assets mentioned herein. The information presented does not involve the rendering of personalized investment, financial, legal, tax advice, or any call to action. Certain statements contained herein may constitute projections, forecasts and other forward-looking statements, which do not reflect actual results, are for illustrative purposes only, are valid as of the date of this communication, and are subject to change without notice. Actual future performance of any assets or industries mentioned are unknown. Information provided by third party sources are believed to be reliable and have not been independently verified for accuracy or completeness and cannot be guaranteed. VanEck does not guarantee the accuracy of third party data. The information herein represents the opinion of the author(s), but not necessarily those of VanEck or its other employees.
All investing is subject to risk, including the possible loss of the money you invest. As with any investment strategy, there is no guarantee that investment objectives will be met and investors may lose money. Diversification does not ensure a profit or protect against a loss in a declining market. Past performance is no guarantee of future results.
© Van Eck Securities Corporation, Distributor, a wholly owned subsidiary of Van Eck Associates Corporation.
Original Post
Editor’s Note: The summary bullets for this article were chosen by Seeking Alpha editors.
Credit: Source link