

Chunumunu
A few months ago, I reviewed the newly launched VanEck CLO ETF (NYSEARCA:CLOI) and came away disappointed with the fund’s disclosures, especially the discrepancy between the CLOI ETF’s mandate that said the fund would invest at least 80% of assets in investment grade tranches of CLOs and the ETF’s disclosures that only 56% of assets were invested in investment grade CLOs. Without further information on the discrepancy, I was hesitant to pass judgment on the fund.
With 6 months gone by, let’s revisit the CLOI ETF to see if the fund’s disclosures have improved and compare the fund’s performance against some peer funds.
Brief Fund Overview
The VanEck CLO ETF is an actively managed ETF sub-advised by PineBridge Investments that provide exposure to the Collateralized Loan Obligation (“CLO”) asset class for retail investors. The goal of the CLOI ETF is to invest primarily in investment grade tranches of CLO securities.
A CLO is a collection of senior loans that have been assembled and securitized into tranches with varying risks and yields (Figure 1).
Figure 1 – CLO Overview (pinebridge.com)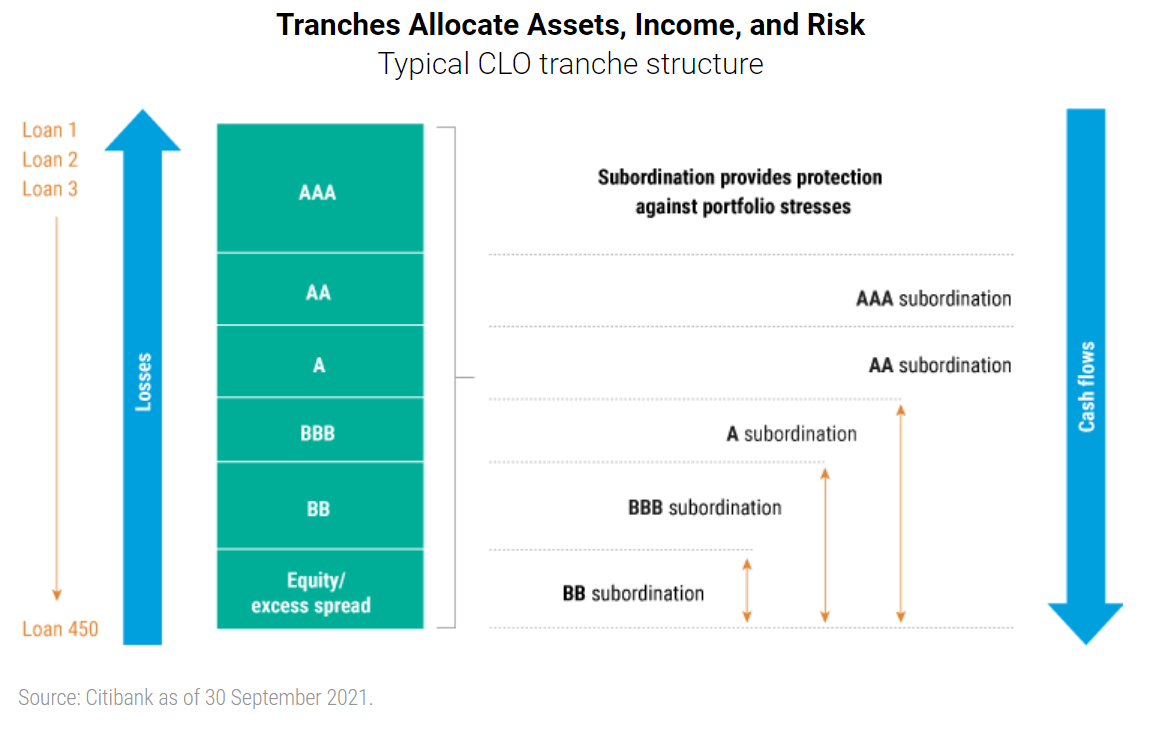
The securitization process allows investment grade securities to be created from underlying loans that may not be investment grade themselves. This financial engineering innovation has given risk-averse investors a broader universe of highly rated securities to invest in.
There are several key attributes to CLOs that investors should be aware of. First, cash flows down through a CLO structure, i.e., cash collected from the underlying loans are used to pay obligations to the AAA-rated tranche first, then the AA-rated tranche, and so on and so forth until all the debt tranches have been paid. Any leftover cash flows are then allocated to the Equity tranche.
On the other hand, credit losses in the structure flow up, i.e. the Equity tranche absorbs losses as they occur. After the Equity tranche is exhausted, the BB-rated tranche will absorb losses, then the BBB-rated tranche, etc.
CLOs are usually overcollaterized, meaning $110 million in loans are pooled to create $100 million in face value of rated securities. By pooling loans from diverse segments of the economy, CLOs have been able to create investment grade securities with remarkably strong credit characteristics. For example, out of the universe of CLO 1.0s (those created before the Great Financial Crisis), only 38 out of over four thousand rated tranches ultimately defaulted, with virtually no defaults in investment grade tranches (Figure 2).
Figure 2 – CLOs have performed well historically (Guggenheim Investments)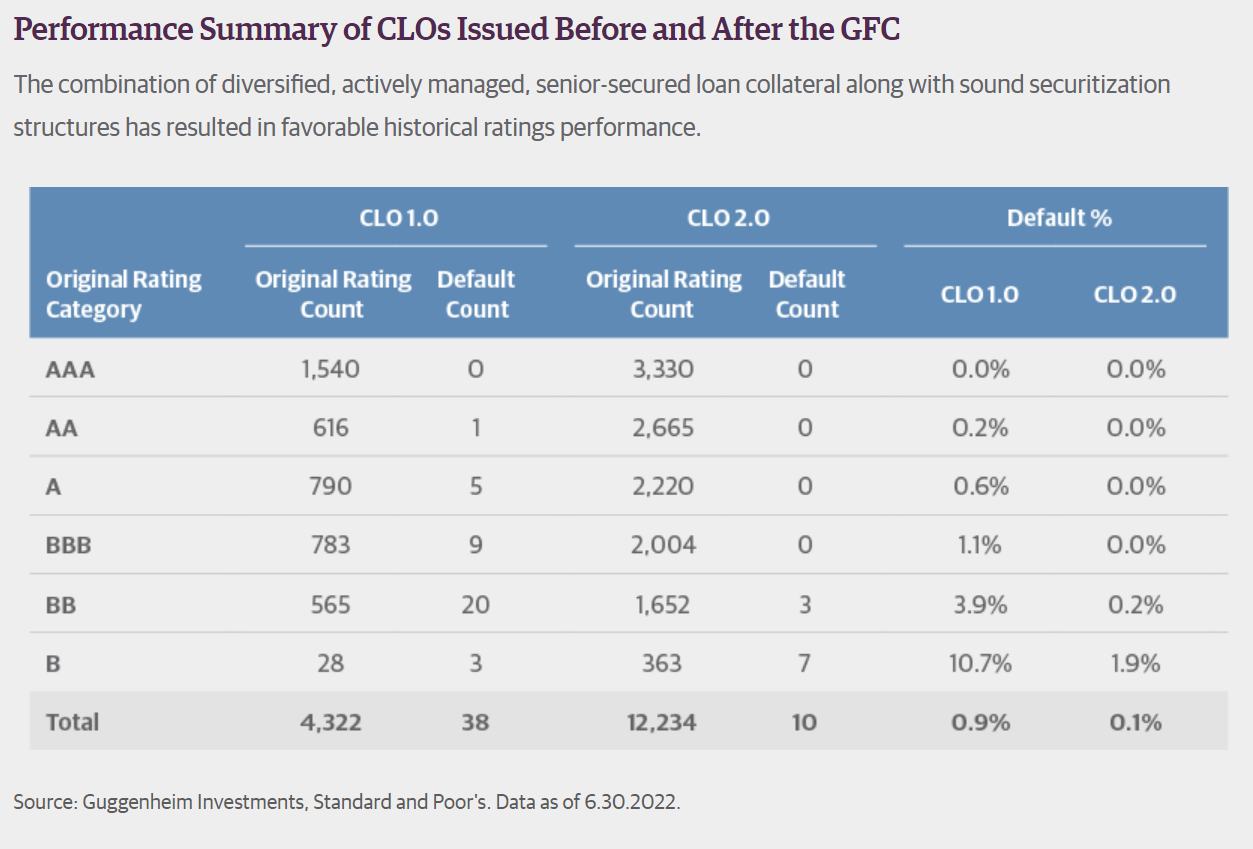
Since 2009, additional rules and tests have been added to the CLO structure to protect investment grade tranche securityholders from losses, further improving credit performance.
Compared to similarly rated corporate bonds and leveraged loans, CLOs have historically delivered higher returns and yet trade at higher yields, the proverbial ‘free lunch’ (Figure 3).
Figure 3 – CLOs have delivered superior returns and higher yields than similarly rated bonds (pinebridge.com)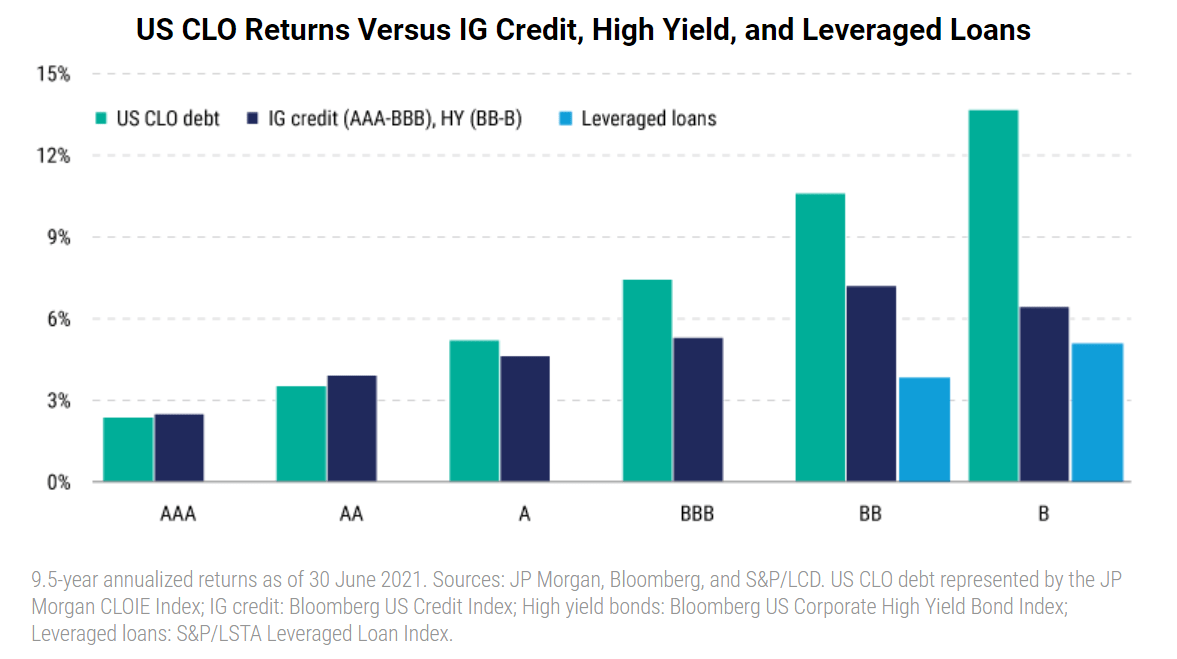
However, investors should note that the exponential growth of the CLO asset class in the past decade and the relative calm markets may have flattered credit performance (Figure 4).
Figure 4 – CLOs outstanding have experienced exponential growth (pinebridge.com)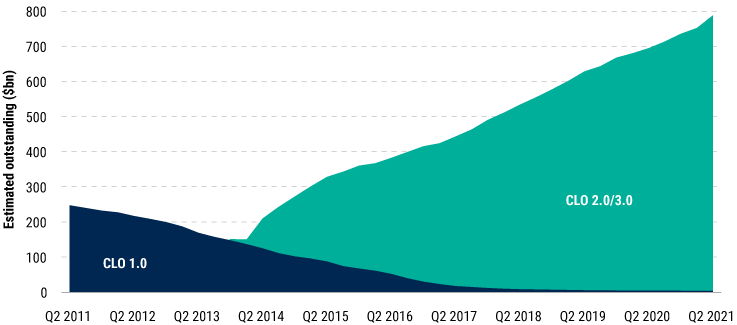
With over a year of operating history, the CLOI ETF has been able to ramp up to a respectable $145 million in assets while charging a 0.40% expense ratio (Figure 5).
Figure 5 – CLOI overview (vaneck.com)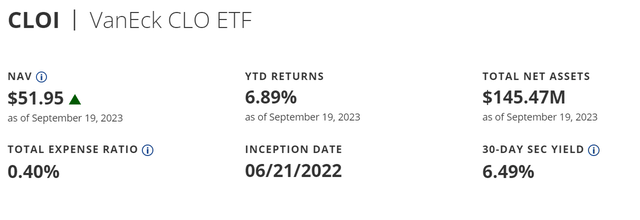
Taking Another Look At CLOI’s Portfolio
In my initiation article, I noted a glaring discrepancy between the CLOI’s disclosure showing only 56% of the portfolio was invested in investment grade securities versus the fund’s mandate of 80%+. I am happy to report that VanEck has improved CLOI’s disclosures, which now show the fund has 95% of assets invested in investment grade securities (83.0% AAA, 10.1% AA, and 2.1% A-rated) (Figure 6).
Figure 6 – CLOI credit quality allocation (vaneck.com)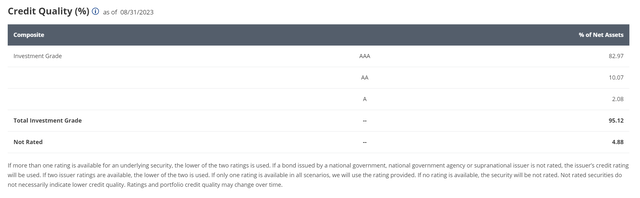
Furthermore, we are now able to see some portfolio-level metrics such as a 6.5% yield to maturity and a portfolio discount margin (which is really the portfolio spread above the floating rate benchmark) of 173 bps (Figure 7).
Figure 7 – CLOI portfolio fundamentals (vaneck.com)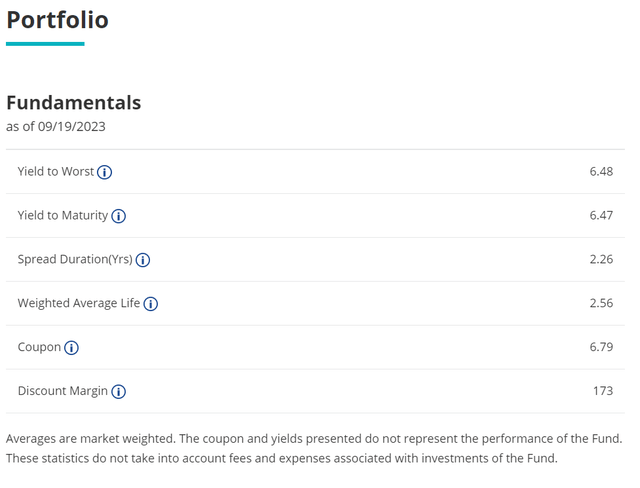
While the information in the individual security list is still sparse (containing only the holding name, coupon, security identifier, market value and par value), the improvement in portfolio-level disclosures is much appreciated (Figure 8).
Figure 8 – Holdings list information is still relatively sparse (vaneck.com)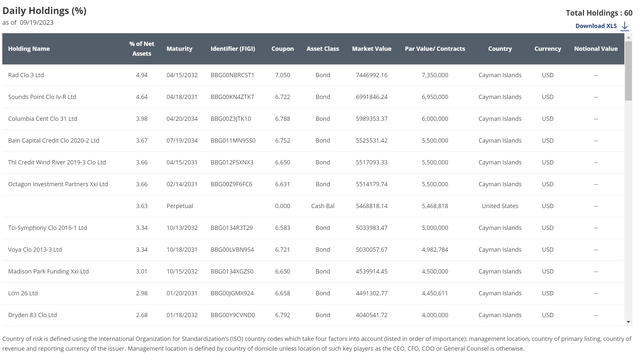
Comparison Vs. Peers
With a clearer understanding of CLOI’s holdings, we can delve into the CLOI ETF’s returns and compare and contrast it to peer funds. Figure 9 shows CLOI’s historical returns. The CLOI has returned 8.1% on a 1yr time frame to August 31, 2023.
Figure 9 – CLOI historical returns (morningstar.com)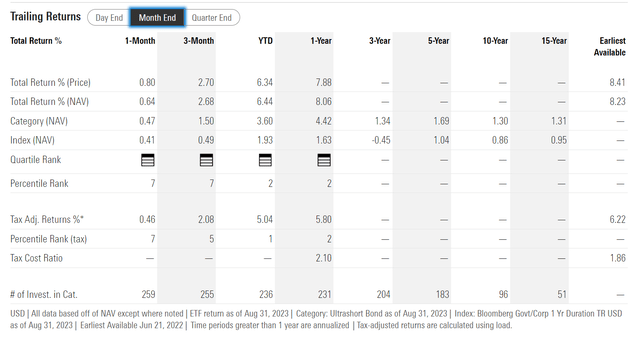
First, we can compare the CLOI to the Invesco Senior Loan ETF (BKLN), which invests in a passive portfolio of leveraged loans that are similar to the loans used to build CLOI’s underlying CLO investments (Figure 10).
Figure 10 – BKLN historical returns (morningstar.com)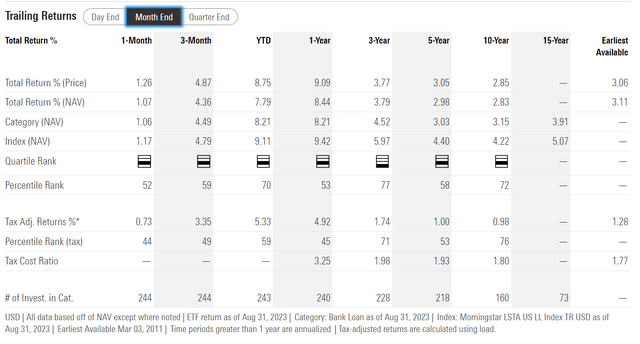
On a 1yr basis, the BKLN ETF has returned 8.4% compared to CLOI’s 8.1%, so CLOI has underperformed slightly. This underperformance can be expected as CLOI is buying investment grade CLO tranches that should have lower default risk compared to BKLN’s non-investment grade leveraged loans.
Next, we can compare CLOI to peer CLO funds, for example, the Janus Henderson AAA CLO ETF (JAAA), which has similar credit exposures to the CLOI ETF. JAAA has 94.5% invested in AAA-rated securities, 0.9% invested in AA-rated, and 5.7% invested in A-rated CLO securities (Figure 11).
Figure 11 – JAAA credit quality allocation (janushenderson.com)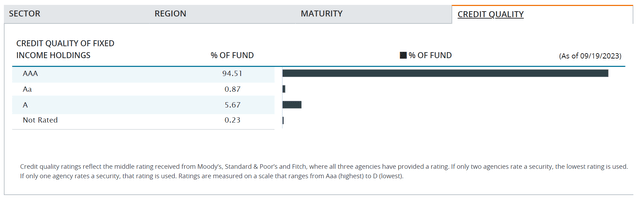
JAAA has returned 7.2% on a 1-yr basis, underperforming the CLOI ETF (Figure 12). However, it is notable that the CLOI ETF has slightly higher exposures to lower-rated tranches, which in theory should offer higher returns.
Figure 12 – JAAA historical returns (morningstar.com)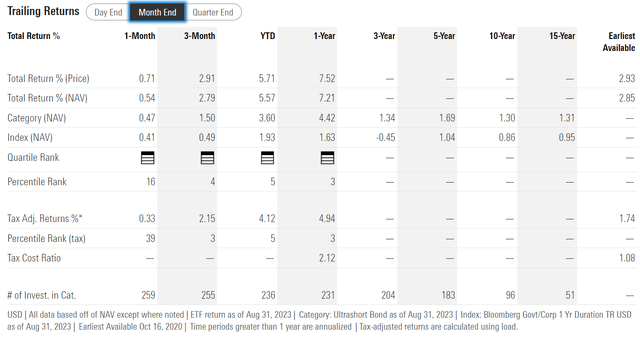
Finally, we can compare the CLOI ETF against the Panagram BBB-B CLO ETF (CLOZ), which invests in lower-rated debt tranches of CLOs. CLOZ’s credit quality allocation is shown in Figure 13.
Figure 13 – CLOZ credit quality allocation (CLOZ factsheet)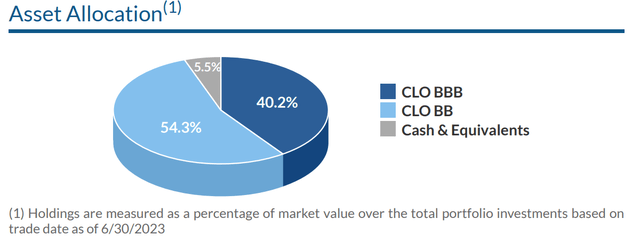
Unfortunately, the CLOZ ETF was only launched in January 2023, so it is difficult to compare CLOI’s relative performance to CLOZ without more operating data.
Making the assumption that market performance in these ETFs approximate their NAV returns, we can come up with Figure 14, which compares the total returns of CLOI, JAAA, CLOZ, and BKLN since CLOZ’s inception on January 24, 2023.
Figure 14 – CLOI vs. peers (Seeking Alpha)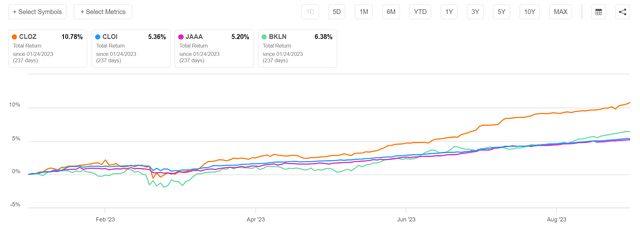
There are 2 interesting observations from this figure. First, the CLOZ ETF has significantly outperformed the peer group, returning 10.8% since inception compared to 5.4% for CLOI, 5.2% for JAAA, and 6.4% for BKLN. This is because CLOZ invests in riskier sub-segments of the CLO market and thus should be able to generate higher returns during favourable market environments.
Another observation is that the CLO ETFs appear to have lower volatility than the BKLN ETF. The BKLN ETF lost close to 2% during the March regional bank crisis while the CLO ETFs suffered far lower MTM losses.
I believe this is because the BKLN ETF primarily consists of non-investment grade leveraged loans, so when markets swooned in March, credit spreads widened and the BKLN ETF suffered MTM losses (Figure 15). On the other hand, the CLO securitization process appears to have sheltered the CLO ETFs, as their investment grade CLO holdings barely registered market turmoil.
Figure 15 – BKLN credit quality allocation (invesco.com)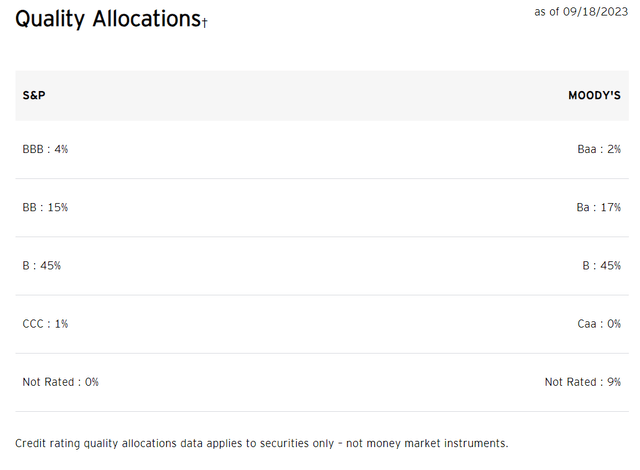
Distribution & Yield
Comparing distribution yields between the peers, the CLOI ETF is currently paying a trailing 12 month distribution yield of 5.3% (Figure 16).
Figure 16 – CLOI is paying a trailing 5.3% yield (vaneck.com)
CLOI’s distribution is actually slightly lower than JAAA’s trailing 5.4% yield. However, CLOI does have a higher total return.
Although Seeking Alpha only shows CLOZ paying a trailing 12 month distribution yield of 6.2%, that is mainly because CLOZ has only been in operation since January. CLOZ has a 30-Day SEC yield of 10.8% and I expect its distribution to eventually ramp up mirror its SEC yield.
Finally, the BKLN ETF pays a trailing 8.4% distribution yield.
Conclusion
Taking another look at the CLOI ETF, I am happy to see that VanEck has finally updated the portfolio disclosures for the fund. With proper disclosures, we can actually compare CLOI’s performance against its peers.
Overall, the CLOI ETF offers income investors a modest return from highly rated assets. Comparing CLOI against its direct peer, the JAAA ETF, CLOI has delivered superior 1 year returns with substantially similar portfolio exposures. I believe the CLOI may be suitable for investors seeking a modest yield from highly rated assets.
Credit: Source link