
tadamichi
Written by Nick Ackerman, co-produced by Stanford Chemist.
The last time we covered the Calamos Convertible Opportunities and Income Fund (NASDAQ:CHI), the premium to the net asset value gave us pause. Today, the premium is a bit lower, but it still also isn’t looking like a steal either – keeping it at about fair value. However, we still have a new annual report to look at for fiscal 2023 to see how the fund was doing. Additionally, we can also look to see what we might be able to expect going forward for those investors who continue to remain invested in this fund.
CHI Basics
- 1-Year Z-score: -0.03
- Premium: 7.91%
- Distribution Yield: 10.58%
- Expense Ratio: 1.38%
- Leverage: 37.15%
- Managed Assets: $1.204 billion
- Structure: Perpetual
CHI states its objective as “seeks total return through capital appreciation and current income by investing in a diversified portfolio of convertible securities and high yield corporate bonds.” This is fairly straightforward but can also be beneficial to retail investors.
Premium Remains Sticky
Since our previous coverage, it looks like the fund has performed fine enough on a total return basis. That includes the share price performance but also the assumption of distributions reinvested along the way. Convertibles are influenced by equity prices, and CHI invests in those securities in a significant way. That said, the S&P 500 still really isn’t a relevant metric to compare directly, but it can still provide some context in terms of what the broader market was doing during this time.
CHI Performance Since Prior Update (Seeking Alpha)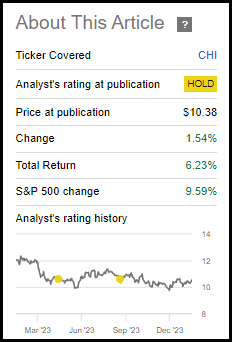
Looking over the longer-term periods, the fund has, on several occasions, traded at premium levels. So, a premium itself isn’t too much of a problem immediately. Even the last 1-year z-score indicates that the fund is simply trading around where it usually does over the last year.
Trading at a premium quite regularly has helped push the fund’s longer-term average discount to be right about flat over the last decade. It was in more recent times that the fund enjoyed even richer premiums, so the shorter time frames made the fund look more attractively priced.
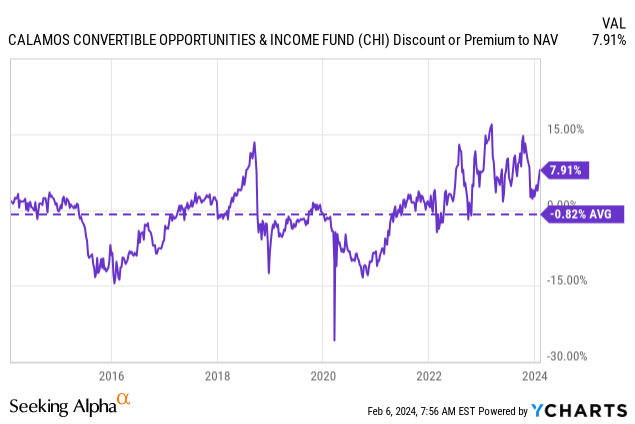
With that being said, even this slightly higher premium for the fund doesn’t seem to be a screaming sell. However, it also isn’t telling us it is a buy either, and that’s why CHI looks to be fairly valued. In my opinion, a continuing ‘Hold’ rating makes sense, as I’d remain neutral at this level.
Overall, in the last few years now, convertibles have not performed very well at all. Higher interest rates did not treat the space well. This led to a struggle for CHI, though the fund’s high-yield bond exposure seemed to help limit some of the downside.
YCharts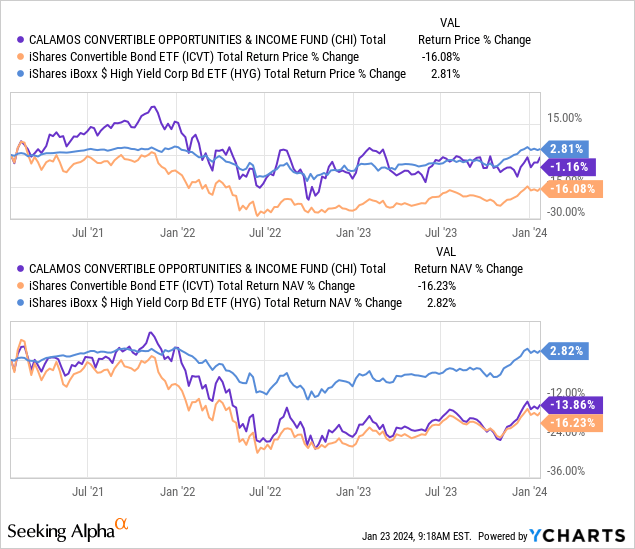
Working against the fund during this period was the high utilization of leverage that the fund employed. That’s the type of leverage that can add volatility and significant risks to investing in CHI -but it can also increase the potential upside reward when times are going better.
Over the long term, the fund hasn’t been able to outcompete in terms of total returns in either market or NAV results relative to something like iShares Convertible Bond ETF (ICVT). One of the reasons for this, besides higher expenses and poor selection of investments, would be the fund’s still meaningful sleeve of high-yield bonds. During this period, iShares iBoxx $ High Yield Corporate Bond ETF (HYG) reflects that – while there were positive results in the period – high yields didn’t perform particularly strongly, relatively speaking.
YCharts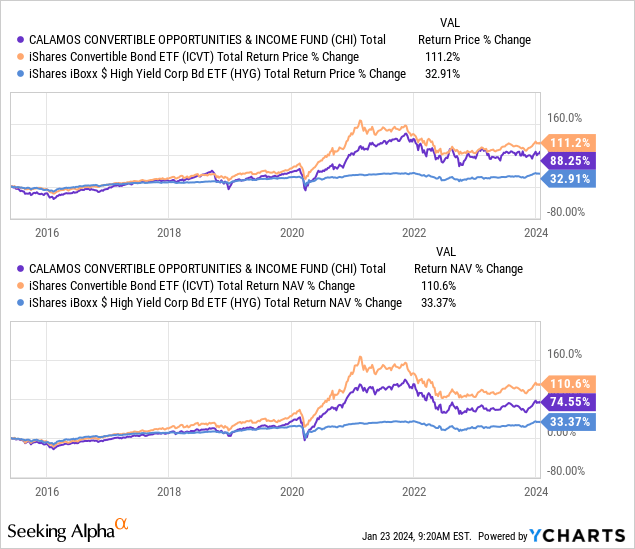
Leverage Costs A Potential Tailwind
Further related to the topic of leverage and forward outlook is the potential tailwind that could be coming in the next year or two. Looking forward, the fund could benefit from seeing lower interest rates as well. The Fed is projecting 3 cuts for 2024, with more to follow up in 2025.
This can turn into a tailwind because it would help alleviate the costs of its borrowings. The fund is pretty highly leveraged as well, which contributed to borrowing costs rising substantially in the last two years. The fund utilizes a portion of its leverage from a credit facility that charges at a rate of OBFR plus 0.80%.
Fortunately, this is only a portion of the borrowings, as they also issued mandatory redeemable preferred shares at fixed rates. These started to benefit the fund with their lower relative rates once the Fed began to hike interest rates aggressively. The rates listed below can be compared to the 5.84% interest rate listed as being charged on their credit facility as of their last annual report, period end of October 31, 2023.
The Fund’s MRP Shareholders are entitled to receive monthly cash dividends, at a currently effective dividend rate per annum for each series of MRP Shares as follows (subject to adjustment as described in the Fund’s prospectus): 4.00% for Series B MRP Shares, 4.24% for Series C MRP Shares, 2.45% for Series D MRP Shares, and 2.68% for Series E MRP Shares.
The larger leverage is the credit facility, which they had $314.4 million outstanding relative to the $133 million in MRP shares. Since that last report, the latest data reflects that these outstanding borrowings have not changed.
CHI Leverage Stats (Calamos)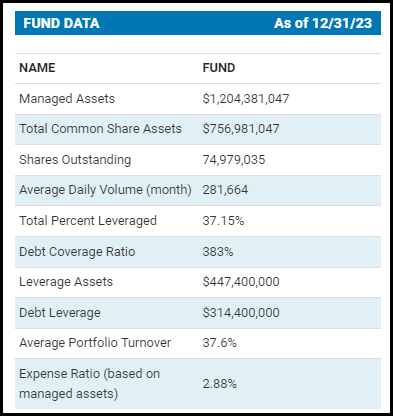
The fund’s expense ratio for operations is 1.38%. Including these borrowing costs, the fund’s total expense ratio climbed to 4.4% in FY 2023. That was up from 2.44% in the prior year.
At the same time, the fund would be able to invest in convertible bonds that offer a bit more yield relative to where we were a few years ago. That could also bode well for the distribution stability going forward.
Distribution Remains Steady
Admittedly, with the last couple of years being particularly rough for the space this fund invests in, I was a bit cautious about the fund’s distribution. The NAV rate had climbed higher – due to the declining NAV as the underlying portfolio’s valuations retreated lower. The pressure on the borrowing costs was also a factor in my hesitation to believe that CHI’s distribution was safe.
That said, the fund continued to pay out the same monthly distribution as they have been for the last several years now. They raised in 2021 to the current $0.095, where it remains today.
CHI Distribution History (CEFConnect)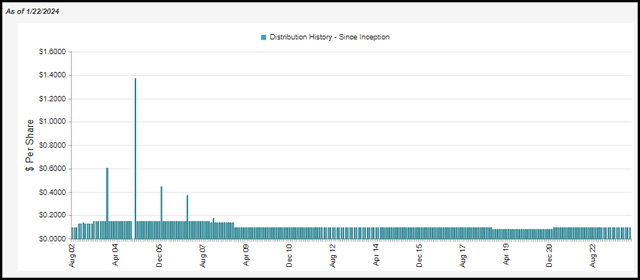
The NAV rate still remains quite high at 11.41%, and due to the fund’s premium, the actual rate shareholders receive is lower at 10.58%. That means the fund has to earn more than what investors receive from the fund. On top of this is the fund’s expense ratio as well that it would also have to earn for the payout to remain sustainable
Their last annual report also showed that the fund had not earned any net investment income at all, as it came in negative. However, this isn’t exactly true because the fund had amortization that reduced total investment income by $12,272,837. Adjusting for that amortization, we would see that NII would have been positive. There were also substantial amortization charges in the prior year, though, of $11,120,706.
CHI Annual Report (Calamos)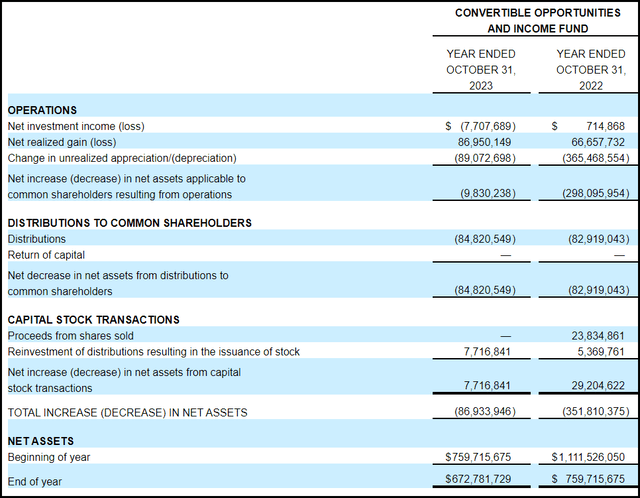
Even if we adjusted for amortization, reducing TII leading to low or negative NII, we see a substantial shortfall in coverage from what the fund is paying out for distributions. Even if rates go lower and that adds some relief to their borrowings, it wouldn’t be enough to cover the shortfall. Thus, the fund is still reliant on capital gains to fund a large portion of the payout for investors.
Due to the premium, the fund is also able to sell new shares through an at-the-market offering and through its DRIP. Since that is accretive for the fund, that is one of the big positives for a fund trading at a richer valuation.
For tax purposes, the fund has largely classified the payouts as ordinary income and long-term capital gains in each of the last two years. This looks significantly different than what we see above and is a good example of where tax classifications and fund earnings are vastly different. Despite negative NII, we still see a substantial portion of ordinary income listed.
CHI Distribution Tax Classification (Calamos (highlight from author))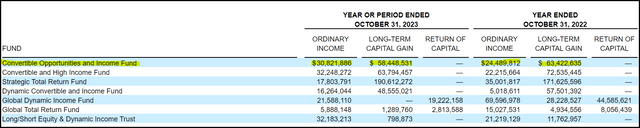
On the other hand, even as the portfolio declined overall and total net assets decreased in each of the prior two years – the fund still realized enough capital gains from its portfolio despite the net losses.
CHI’s Portfolio
CHI had a fair bit of portfolio turnover in the year. Actually, the last two fiscal years saw the same turnover at 39%. That said, there wasn’t a substantial shift in the overall approach of the fund.
The largest allocation is allocated to convertible securities, quite similar to the 66.4% we saw previously. High-yield corporate bonds made up another 25.62% of the fund. The remaining composition of the fund is split between marginal allocations of other security types.
Of course, this is consistent with the fund’s investment policy and approach – we don’t really expect this weighting to see dramatic shifts.
CHI Asset Allocation (Calamos)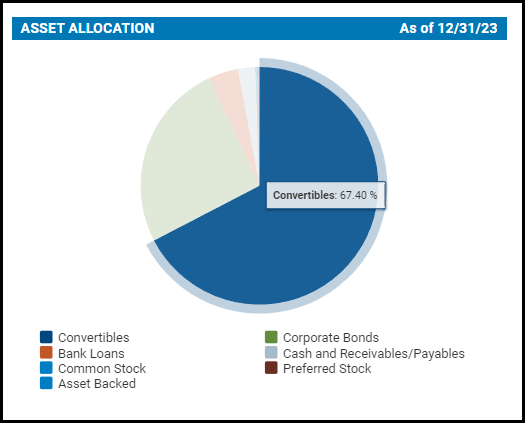
The fund also tends to see only fairly marginal shifts in the sector exposure. CHI tends to hold the highest allocation to the tech sector, which is fairly typical of convertible funds. Tech allocation for the fund has come down from where it was a few years ago, which had the fund’s tech weighting at just over 21%. However, from our last update, the fund’s tech weighting actually crept up from the 17.8% it was at.
CHI Sector Weighting (Calamos)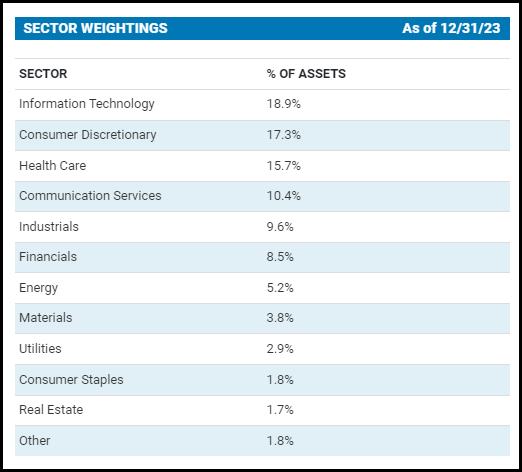
Overall, the fund’s sector composition provides a fair bit of diversification. The top few sector allocations are the highest by a meaningful bit, but this is still much better than what we see in other places. Even the S&P 500 Index itself carries a more concentrated allocation to tech at nearly 30%.
CHI is further diversified when it comes to the actual individual holdings as well. The top ten comprise 13.7% of the fund’s invested assets, and none are at a notable overweight allocation.
CHI Top Ten Holdings (Calamos)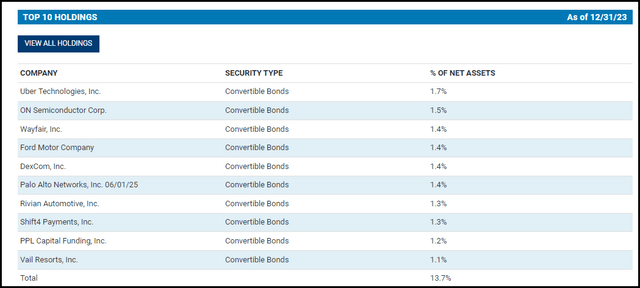
That’s been one of the changes over the last couple of years for the fund, too. At one point, Tesla (TSLA) did have a particularly large portion of the fund’s assets at ~5%. While that isn’t the most extreme overweight we’ve seen in a fund, in the context of CHI, it was something that did stick out when everything else was within basis point differentials of each other.
Conclusion
CHI remains a solid fund delivering distributions for its shareholders. The premium has come down since our prior update, but not enough for me to get too excited and want to jump in yet.
That said, going forward, the fund could benefit from a lower rate environment to help alleviate the burdens of its borrowing costs. That should help ease pressure on the fund’s income-generation ability. At the same time, the fund had been able to pick up some higher-yielding convertibles in the now higher-rate environment, too. That bodes well for the future sustainability of the distribution – even if I think right now it’s on the elevated side.
Of course, the fund is still subject to the general risk of a stalling economy. If rates are getting cut aggressively, it is likely because the economy is faltering aggressively. Given the generous application of leverage by this fund, the volatility and risks are increased during such a period. Therefore, the best scenario for this fund – and so many other investments – would be that soft landing that remained elusive historically but still possible.
Credit: Source link