
M. Suhail
Shares of Charter Communications (NASDAQ:CHTR) have been a poor performer over the past year, losing nearly 23%, in what has been a bull market. Weak internet customer growth combined with a very large debt load have pressured shares significantly. In December, I rated Charter a “sell” as I worried its large debt load could force the company to reduce buybacks given weak growth and strained free cash flow. Since then, shares have fallen by about 31% while the S&P 500 has risen by 5%. Frankly, shares have fallen even more sharply than I expected, and so with Q1 results set to be released April 26th, now is a good time to revisit CHTR. While fundamentals are challenged, valuation is better reflecting this but I see reasons to remain cautious.
Seeking Alpha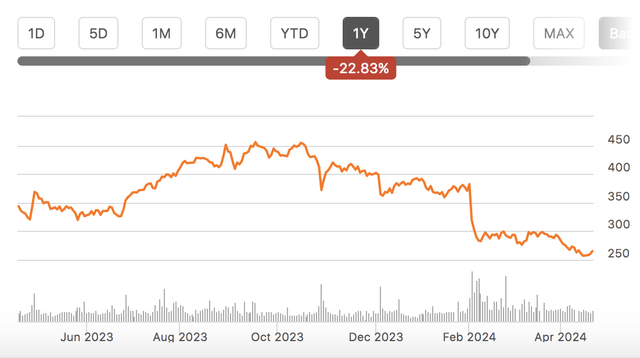
Charter Communications’ Q4 results were weak
Before thinking about what Charter could report in Q1, it is worth taking a moment to refresh on Charter’s most recent results, which were poor. In Q4, it earned $7.07, which missed estimates by $1.70. EPS fell about 8% from last year even with the benefit of a 3.8% lower share count. Earnings were down even as revenue rose by 0.3% from 2022 at $13.7 billion. For the full year, revenue rose by 1.1%, and adjusted EBITDA grew by 1.3% to $21.9 billion.
That is because pre-tax income fell by $169 million or 9% from last year, primarily due to a $42 million increase in stock-based compensation and a $92 million increase in interest expense to $1.32 billion. That share-based compensation was due to grants given earlier in the year. Given the weak share performance in 2023; I would expect this to decline in 2024 whereas interest expense is likely to continue to rise modestly due to refinancing debt at higher rates.
Charter’s core problem is customer growth. For years, cable companies have been losing video subscribers as more consumers “cut the cord.” However, they have mitigated these losses by adding internet subscribers; if anything, streaming demand should make quality broadband even more important. However, this source of growth has seemingly dried up. In Q4, the company lost 110k customers, and its customer base is 0.2% lower than a year ago at 32.1 million as a 0.3% decline in consumer relationships offset a 0.7% rise in business customers. 78% of revenue comes from consumers, which is why a smaller residential decline more than offsets ongoing business subscriber growth. Overall, Charter lost 61k internet customers and 257k video customers, and added 546k mobile customers.
Charter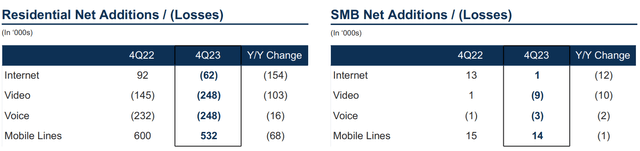
Because of stronger gains earlier in the years, internet customers were up 0.5% from last year while video was down by 6.8% and voice down 10.9%. Mobile was up a tremendous 46.8% to 7.8 million. The growth in mobile is impressive, but it just is not big enough to offset weakness elsewhere. Mobile service is less than 5% of revenue but rose 36% to $626 million. This $165 million increase was half of the $347 million drop in video to $3.9 billion. Internet revenue rose 3% to $5.8 billion. In aggregate, revenue was up by $37 million from last year in Q4, and mobile device sales rose by $150 million to $771 million, so total service revenue was actually down year on year.
In the past, Charter has also been able to offset subscriber pressure via price increases, but even that avenue appears to be slowing. Revenue per residential customer was up just 0.1% at $119.41. On the bright side, given a declining video customer count, programming costs were down by 10.6%. Nonprogramming costs of revenue jumped 15% while service roses rose 2.1% and marketing fell by 1.6%.
Charter is also having to spend more on its network, and given it is not adding customers, the return on its invested capital is declining. Q4 capex of $2.9 billion was down about 2% from last year. For the full year through, capex rose by nearly $1.8 billion to $11.1 billion. This larger capex spending is big reason that free cash flow of $3.5 billion in 2023 was down by $2.6 billion from 2022. Specifically in Q4, CHTR generated $1.06 billion of free cash flow vs $1.14 billion in Q4 2022. During the fourth quarter, Charter spent $1.3 billion on stock buybacks, paying $419 on average; given where the stock is trading now, that was not the most prudent allocation of capital.
Overall, Q4 showed ongoing weakness in video, disappointing internet results, and growth in mobile that is simply too small to offset losses elsewhere. Its capex spending remains elevated, and CHTR continues to spend all free cash flow on buybacks.
Charter Q1 earnings – what to focus
Given how weak Q4 2023 was, my expectations are fairly muted for Q1. However in Q1, analysts are expecting Charter to earn $7.87 on an adjusted basis, which is up from the $6.65 reported last year. Q1 can also seasonally have higher stock based compensation (it was over $200 million last year), which would be a sequential drag on results. This consensus implies an acceleration in earnings QoQ. However, both Q1 2023 and Q1 2022 showed lower earnings than the preceding Q4, given seasonality in the business.
As such, I see risks skewed to CHTR missing estimates this quarter. Now, given how much shares have underperformed, investors’ expectations may be for the company to miss sell-side estimates, which could also be a bit stale. Revisions have been trending down consistently, and its possible we see analysts lower estimates as they fine-tune models this week into the release. I would also note that management has been talking down the quarter. At a March conference, Charter said there was in a “lull” in terms of adding net internet customers. On the bright side, churn remains low, but there are low “gross adds,” leading to a difficult net add environment. In particular, it is struggling to generate internet growth in existing markets, given competition from wireless and wireline providers. One challenge for Charter is the housing market. Housing transactions remain low as consumers with low mortgages are reluctant to move. When a customer moves, there is a prime opportunity to acquire the new resident. With less moving, this creates less natural churn. This is a headwind that seems unlikely to abate given the elevated rate environment.
I am going to be particularly focused on internet net additions. I am bracing for another sequential decline given this commentary, but if we see a sequential improvement (i.e. a drop of under 30k), that could be seen positively. I will also be tracking mobile revenue growth vs subscriber growth. Charter has added customers in part due to heavy promotional activity. Its mobile customer count is up 47%, but revenue was up 36%. I would like to see CHTR gradually close this 11% gap. We need to see mobile revenue reach a critical mass to become more relevant to the bottom line. Right now, the growth is impressive, but the revenue contribution is just not sufficient to move shares.
Ultimately, we are likely to see another weak quarter, and it seems to me consensus does not fully reflect this. The question is whether shares have been sufficiently beaten down that even a mixed quarter can lead to a positive share reaction.
CHTR’s capital structure concerns remain
This is where the company’s debt load and free cash flow comes into focus. CHTR carries $97.6 billion of debt. As you can see below, it has substantial debt maturing essentially every year, just given how much debt it has. It has already refinanced its 2024 maturities, but if rates remain this high, interest expense could rise in 2025 when it rolls over debt.
Charter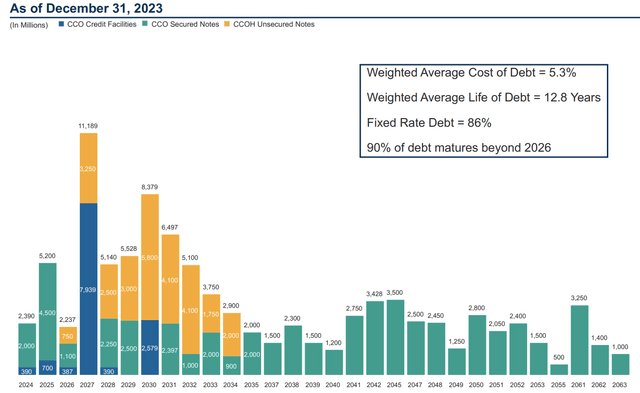
Not only does Charter carry a lot of debt on an absolute basis, but it carries a lot of debt relative to its own financial targets. At Q4, net debt/EBITDA leverage was 4.42x. Management intends to stay “at or just below the high end” of its 4-4.4.5x debt to EBITDA range. In my view, this was management’s way of saying that it will continue to use all free cash flow for share repurchases rather than debt reduction.
Still with debt so elevated and interest rates high, this is an aggressive financial policy. This is particularly true because it will be difficult for CHTR to “grow” its debt load. In theory by growing EBITDA 8-10% and holding debt flat, CHTR could bring leverage to the low end of its target. However with EBITDA rising just 1%, that would be a long process. Furthermore, if internet adds continue to be negative, it could be difficult for CHTR to move pricing enough to keep EBITDA growing.
As such, leverage is likely to remain near the high end of its range for some time. Frankly, I would rather see CHTR try to reduce debt and buy back less stock, but that does not appear to be the direction management is taking. That said, we are likely to see buybacks fall as I see some pressure on free cash flow.
Back in December, I felt Charter could generate about $4 billion in free cash flow with minimal long-term growth prospects. Now, 2023 free cash flow was $3.5 billion, but there was a nearly $500 million headwind from working capital, so my 2024 forecast essentially assumed a year similar to 2023 without a working capital headwind. However, alongside Q4 results, CHTR guided to $12.2-$12.4 billion in capex spending this year, up by $1.2 billion.
Charter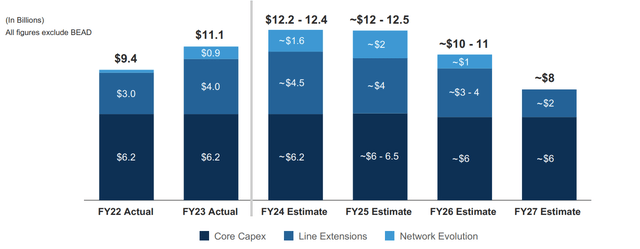
This 2024 spending is greater than I initially expected, and I am concerned about the efficiency of the capital spending. CHTR is spending more on capex every year even as its customer growth slows, or even dips negative. It is spending more to win fewer customers, in part because it has essentially maxed out its customer base on its existing network and is now fighting to defend market share from wireless and wireline providers.
I believe investors will be focused on commentary around long-term capex spending. There will need to be confidence 2024-2025 represent the actual peak and that spending can decline in later years to boost free cash flow. I am concerned about long-term projections. Just given inflation and the fact its network is larger, I am not sure it is likely core capex can be lower in 2027 than 2022, for instance.
Given higher capex spending, free cash flow in 2024 is likely to be $2.5-$3 billion in my view. This means buybacks will be a bit lower than the $3.2 billion in 2023. I would expect CHTR to allocate essentially all of its free cash flow to buybacks, but not much beyond free cash flow as debt is already high. It also should be noted about $600 million of buybacks just go to offset share based compensation, so the true level of share count reduction is akin to a ~$2 billion net repurchase.
Conclusion
Overall, this is a negative picture for Charter. Its most recent results were soft, and management commentary implies pressures on internet additions remain. I do not see a strong argument for a sequential acceleration in the business, which creates a downside risk to Q1 results. Furthermore, the business is becoming increasingly capital intensive, even as customer growth slows, and its balance sheet is fairly leveraged at a time of high rates. Given these fundamentals, the only reason I would buy Charter is if valuation becomes extremely cheap.
I believe free cash flow is the right way to value this company, particularly given its focus on buybacks. Net of share-based compensation. CHTR has about $2-2.2 billion of free cash flow this year. That leaves shares with a 5% free cash flow yield. Assuming an 8-10% required return, CHTR would need to grow free cash flow 3-5% per year to justify where it trades today.
Given its minimal topline growth, that is an implausibly fast growth assumption in my view. The only way to generate this much growth would be to reduce capex, as is planned in 2026. For 2024-2025, CHTR is a low $2 billion cash flow company. At $10.5 billion in capex though, it could be a ~$4 billion free cash flow entity again. At an 8% free cash flow multiple to reflect its minimal top-line growth prospects, that would be worth $308. Assuming a ~10% share count reduction over the next two years, CHTR could be worth ~$340 in two years’ time. That is a 13% annualized return over the next two years.
As noted, I am skeptical CHTR will reduce capex that much, and 2026 is a long time away, but this type of capex reduction and stabilization of its internet business are needed to justify a recovery in shares back above $300. Otherwise at a 5% free cash flow yield, shares would still be expensive. Investing in Charter requires a long-term time horizon for this to play out. If we do not see capex fall and free cash flow remains low, shares could have further downside. Assuming capex falls by just half as much as guided, shares have about 13% downside to $231 in two years, which would be about $258 assuming share count reduction.
Giving 1/3 weighting to the bullish scenario and 2/3 weighting to my more cautious capex outlook suggests a two-year forward fair value of ~$286. That is just a 4% annualized return over the next two years. Given this is a positive return and given how much shares have fallen since my sell recommendation, it is a close call, but I do not believe a “sell” is still merited. However, shares are not cheap enough to merit a buy either. As such, I am moving to hold and would be a buyer only if shares fall to $240 or lower, as that creates sufficient upside to my 2-year target of $286. I am cautious into earnings and would stay on the sidelines. If results do cause another large drop, that could be an opportunity to buy, but for now, investors should hold off.
Credit: Source link