
da-kuk
One
Welcome to the post-September OPEX window of vulnerability. As a result of how systematic flows dominate today’s financial markets, the one to two weeks following the day of the monthly options expiration generally represents a short period whereby supportive Vanna and Charm flows (see here for a refresher) that drive stocks higher under normal market conditions are much less prominent. Such windows create a period of vulnerability during which macro flows and fundaments are more impactful to the movement of broad market indices, most notably the S&P 500.
There are no guarantees stocks must go down during such periods, but the ability of the S&P 500 (in which most structured products are tied) to experience much larger moves in one direction or another is enhanced. That the September OPEX (Friday last week) precedes a nearly five-week period before October OPEX on the 17th of next month opens a larger window to which the supportive Vanna and Charm flows are not present, ushering in a potential period of higher volatility (upside or downside) over the next two to three weeks.

Two
This is the primary reason why the second half of September early October is generally the least favourable time of the year for the stock market. The market is simply more vulnerable to negative flows during this period. Does this mean stocks are going down over the next few weeks? I am skeptical.

Three
Indeed, the presence of vulnerability does not preclude the market to a negative outcome. The fact the S&P 500 has already experienced a poor few weeks creates a situation whereby the likelihood of unfavourable moves during these windows of weakness is actually reduced. This is where measures of market internals and positioning provide such valuable insight.
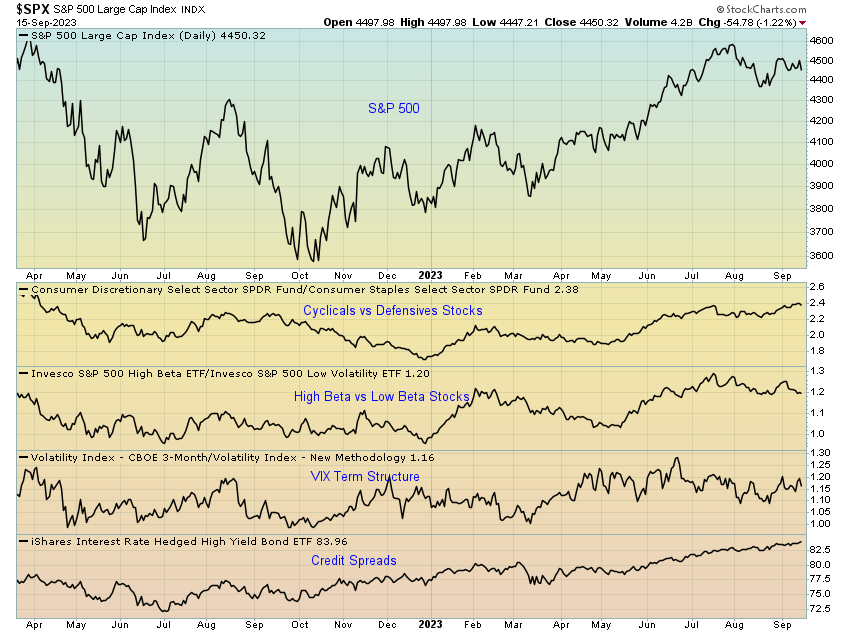
As it stands, market internals seem to be holding up relatively well. Although my cyclical index – which measures the relative performance of the most economically sensitive sectors of the market to the S&P 500 – disconfirmed much of the recent move upward, my risk appetite index continues to hold firm as it has done for much of the past 12 months.


Four
If we look at other measures of market internals (some of which are included in the above indices), such as the cyclicals vs defensives ratio, the high-beta/low-beta ratio, the VIX term structure and the interest rate hedged credit ETF (credit spreads proxy), none are moving materially to the downside and suggesting a significant level of selling pressure should ensure. In fact, none are highlighting there is material weakness under the hood and are actually suggesting this looks like another dip that should be bought into year-end.
Five
What is also tilting my bias bullishly for the next few months is the reset in positioning we have seen these past couple of weeks. While positioning across the board reached extreme bullish levels through July and August on the back of the AI/tech frenzy, we have since seen a swift unwind. This can be seen below through the lens of the AAII Bull/Bear Ratio and NAAIM Exposure Index, both of which have reset from extreme bullishness to neutral levels.


Six
The same can be said of hedge funds, which have significantly de-grossed over the past couple of weeks. According to SentimenTrader, hedge funds are now the least exposed to stocks they have been since the market bottomed in Q3 of last year.

Seven
If we are to see downside follow-through during this period of vulnerability, we need to see a sustained spike in implied volatility that will cause a cascade in selling for systematic investors and dealer hedging flows. Given how well-supplied volatility is at present and that overall positioning has returned to a fairly neutral state, this does not seem likely.

Eight
Indeed, the fact volatility continues to be well-supplied and make lower lows (blue line, inverted below), and as we have already had a positioning reset means the probabilities seem to favour further upside as opposed to the downside into year-end. Although I continue to opine an underweight exposure to risk assets is warranted on a cyclical basis, the short-term risk for the stock market has been to the upside for much of the last 12 months and it seems this trend is likely to continue into early 2024.

Nine
Performance could also play a role in a year-end blow-off top-style move. Career risk is real and such discretionary investors who have been underweight equities and thus underperformed all year will want (or need) to get in on the action. There is still plenty of cash left on the sidelines.

When you combine performance chasing with neutral/underweight positioning, along with well-supplied volatility that drives systematic and structural flows as well as a resilient economy and solid jobs market, you get a concoction of right tail risk for stocks.
Ten
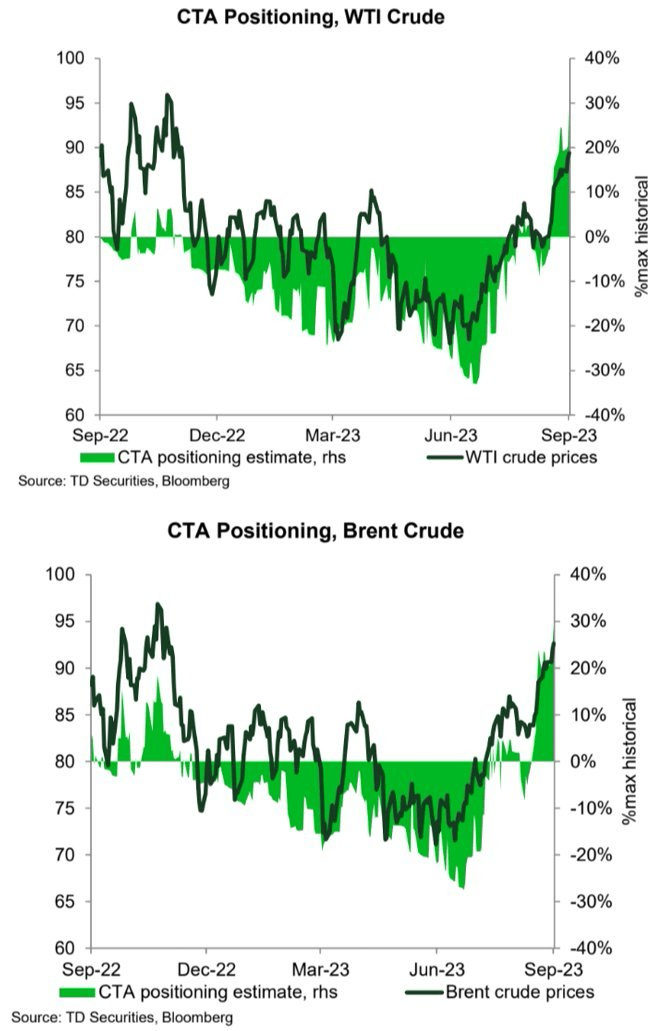
In my last Chart Book, I discussed the bullishness surrounding crude oil and its supportive fundamentals. That picture has not changed. However, it is worth highlighting how hedge fund and CTA positioning in the oil market has now reached extreme bullish levels as these market participants have gone from very short to very long, squeezing prices higher in the process.
Eleven
When considering this stretched positioning in context with the fact that oil prices look to be butting heads with an important resistance level around the $90 mark, whilst also having completed a 9-13-9 DeMark Sequential sell signal, the oil market seems well due for a pullback. A move back to the mid-$80s seems an excellent opportunity to add. I continue to remain cautiously bullish oil prices into year-end, and I can easily see this rally topping out around the $95-$100 level for WTI, though I remain skeptical prices will meaningfully exceed triple figures, I still believe that to be a story for 2024/25 rather than 2023.

Original Post
Credit: Source link