

PM Images
Thesis
The Central Securities Corporation (NYSE:CET) is as boring as an equity CEF can get. It lacks the glitz and glam of tech investments, the untapped potential of private funds, and the drama associated with crypto exchange equities. But boring can be very profitable, especially when ‘boring’ outperforms the S&P 500 with the same volatility analytics.
We tend to cover CET yearly since it is not a name that changes structurally, and we will re-visit the name after our last article on the fund came out in 2023.
No monthly distribution? No problem
One of the features that retail investors enjoy enormously around equity CEFs is the monthly distribution one. Equity CEFs transform equity returns into dividends, and managers tend to distribute those returns monthly. CET does not do that, with only two dividend dates per year:
Dividend History (Seeking Alpha)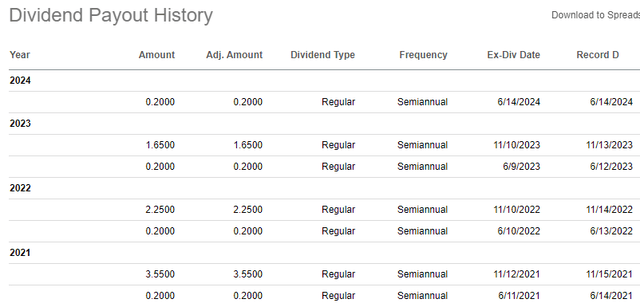
The fund has a June distribution that pays out $0.2/share, and a variable November distribution date that fluctuates based on the fund’s performance. To better understand how the variable distribution works, let us have a look at the CEF’s historic NAV figure:
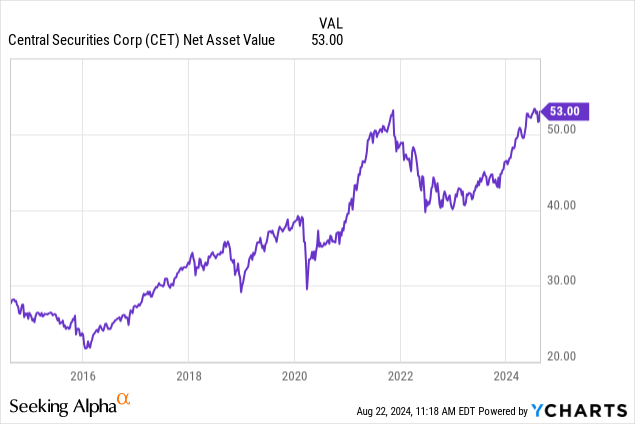
Unlike many CEFs which have very stable NAVs long term, CET likes to see a steady up-sloping net asset value. That translates into its variable distribution in November always being less than what the fund actually makes, thus having an accreting effect on net asset value.
We like the fact that the CEF has not succumbed to the marketing mania of monthly distributions, and continues to do what it does best and increase its NAV as it goes.
Outperforming the S&P 500
Despite the many critiques throughout the years that CET’s management just clips fees, the CEF has proven itself in the past year by beating the S&P 500 from a total return perspective:
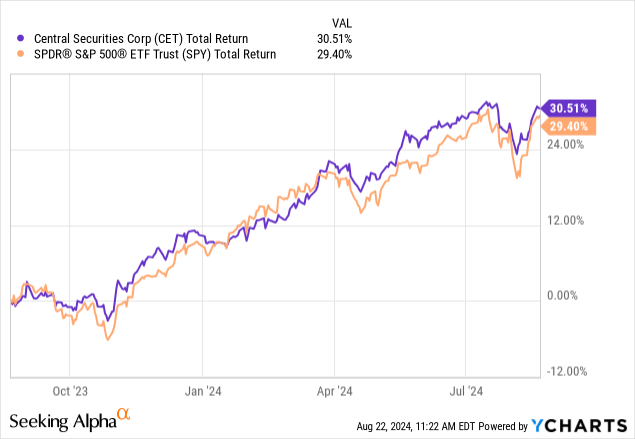
While small, the outperformance talks volumes about the abilities of the management team to justify its existence. One would rather take CET over monthly paying CEFs that embed many bells and whistles but fail to outperform or even match the SPY performance.
Do not expect the discount to narrow
As we mentioned in the thesis section, CET does not change structurally much, thus the market does not fluctuate significantly when it comes to its discount to NAV:
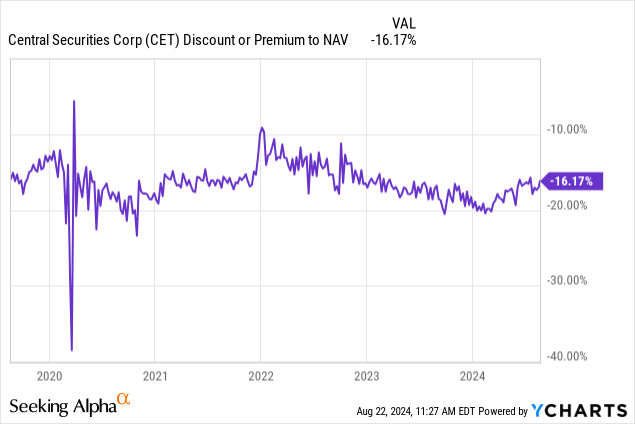
A -16% discount to NAV is the equilibrium level for this name, with the fund going to -20% discount on the back of significant risk-off events, and moving towards -10% during overall market melt-ups.
This feature is not very tradable for the name, since the moves happen over long periods of time and are associated with tail risk events.
Holding a large private insurance company
What is very particular about CET, and an aspect that has been beaten to a pulp in the past few years in the financial press, is the CEF’s holding of the Plymouth Rock Company:
Top Holdings (Fund Website)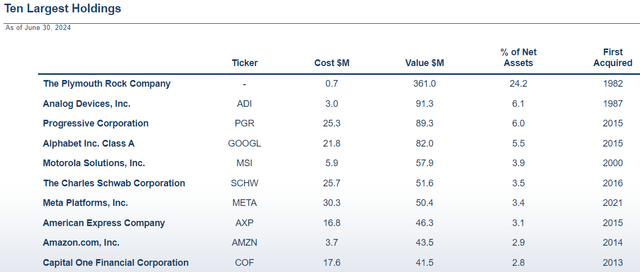
Over 24% of the fund’s assets are held in this name, and prospective investors need to be very comfortable with the insurance line of business and more illiquid holdings.
We like how the CEF spells out the holding period for its top names, since it shows true buy-and-hold intent for businesses that will compound. The Plymouth Rock has been held since 1982 and has proven to be a steady compounder for the name. Expect this company to be there for the foreseeable future, and as an investor in CET you need to be comfortable with this business line:
Plymouth Rock, founded in 1982, is a privately held insurance company that writes personal and commercial lines of business in the Northeastern United States
Kindly note that another famous buy-and-hold company, namely Berkshire Hathaway, has owned the GEICO insurance company since 1999.
Expect CET to continue to be a mostly buy-and-hold fund, with the portfolio turnover figure from Morningstar speaking volumes in this regard:
Portfolio Turnover (Morningstar)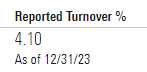
The reported turnover as of December 2023 is a meager 4%, which pales in comparison to other equity CEFs.
Largest risk factor – insurance and financials
While CET has proven itself to be a true ‘Steady Eddy’ in the past years, investors need to acknowledge the intrinsic risks associated with the name holding a large illiquid stake in an insurance company, and the overall focus on Financials/Insurance:
Sectors (Fund Website)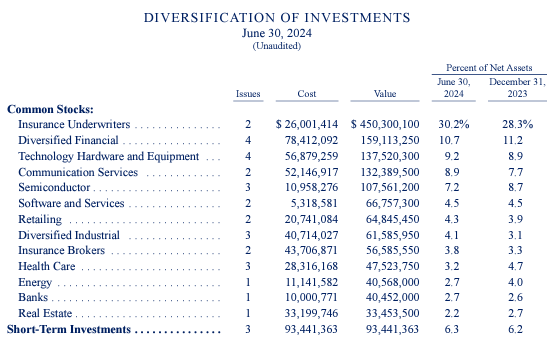
Insurers and Financials make up over 40% of the fund holdings, thus representing the largest risk factor for the name. The current base case in the market, namely a soft landing, represents an ideal macro environment for those sectors.
The worst-case scenario for the fund is a severe recession, where consumers are unable to pay their dues, thus causing large financial companies and insurers to take loan loss provisions and hits to their book values. Currently, such a scenario is remote, but it is the largest risk factor for this name.
Kindly keep in mind that even if a mild recession were to occur, the fund has a bit of flexibility in terms of where it marks its Plymouth Rock position, which is classified as a Level 3 asset:
Level 3 Securities (Fund Website)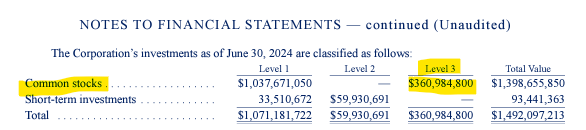
Level 3 assets are those instruments that are not traded. Thus market participants rely on observable inputs to derive a price:
Level 3 securities are instruments that are not traded in the market. As such, no observable market data for the instrument is available, which necessitates the use of significant unobservable inputs.
BDCs and other entities holding privately negotiated loans are famous for being able to show resilient marks even when the liquid, traded HY market experiences bouts of risk-off. The point to take home here is that fundamentals matter more than short-term occurrences when the likes of Plymouth Rock are valued.
Conclusion
CET is an equities closed-end fund. The vehicle is the definition of a ‘Steady Eddy’ equity CEF, and has managed to stay ‘boring’ throughout the years with only two distributions per year, one of them variable. The fund is a rare breed in that it targets an accreting NAV, and has been able to slightly outperform the S&P 500 in the past year. The vehicle’s discount to NAV does not fluctuate much, and is not a readily tradable feature for shorter swing trades. CET keeps delivering in a steady, boring fashion, and exhibits all the elements of a true buy-and-hold name. In our yearly revisit of this CEF we are still a ‘Hold’ for the name.
Credit: Source link