

















• bitcoinBitcoin(BTC)$80,237.002.14%
  • ethereumEthereum(ETH)$2,416.063.67%
  • tetherTether(USDT)$1.000.05%
  • binancecoinBNB(BNB)$715.971.90%
  • rippleXRP(XRP)$1.322.05%
  • usd-coinUSDC(USDC)$1.000.04%
  • solanaSolana(SOL)$96.442.87%
  • tronTRON(TRX)$0.318599-0.48%
  • Figure HelocFigure Heloc(FIGR_HELOC)$1.050.00%
  • zcashZcash(ZEC)$1,315.110.32%
  • HyperliquidHyperliquid(HYPE)$82.11-5.46%
  • dogecoinDogecoin(DOGE)$0.0767871.95%
  • moneroMonero(XMR)$636.12-0.32%
  • USDSUSDS(USDS)$1.000.02%
  • whitebitWhiteBIT Coin(WBT)$77.572.76%
  • chainlinkChainlink(LINK)$11.523.07%
  • leo-tokenLEO Token(LEO)$9.350.35%
  • cardanoCardano(ADA)$0.1975733.04%
  • stellarStellar(XLM)$0.1660500.97%
  • bitcoin-cashBitcoin Cash(BCH)$289.384.77%
  • nearNEAR Protocol(NEAR)$4.01-1.84%
  • daiDai(DAI)$1.000.05%
  • Ethena USDeEthena USDe(USDE)$1.000.10%
  • uniswapUniswap(UNI)$7.38-1.02%
  • litecoinLitecoin(LTC)$55.721.43%
  • RainRain(RAIN)$0.006018-3.19%
  • CantonCanton(CC)$0.1008972.14%
  • avalanche-2Avalanche(AVAX)$8.750.60%
  • suiSui(SUI)$0.921.07%
  • USD1USD1(USD1)$1.000.00%
  • tether-goldTether Gold(XAUT)$4,111.782.09%
  • the-open-networkGram (prev. Toncoin)(GRAM)$1.15-2.70%
  • hedera-hashgraphHedera(HBAR)$0.0720931.08%
  • quant-networkQuant(QNT)$202.410.97%
  • Global DollarGlobal Dollar(USDG)$1.000.03%
  • shiba-inuShiba Inu(SHIB)$0.0000051.43%
  • BittensorBittensor(TAO)$234.111.55%
  • paypal-usdPayPal USD(PYUSD)$1.000.02%
  • crypto-com-chainCronos(CRO)$0.0521451.37%
  • Ripple USDRipple USD(RLUSD)$1.000.04%
  • EthenaEthena(ENA)$0.179278-2.79%
  • Ondo US Dollar YieldOndo US Dollar Yield(USDY)$1.150.04%
  • okbOKB(OKB)$110.591.53%
  • Circle USYCCircle USYC(USYC)$1.140.01%
  • pepePepe(PEPE)$0.000005-2.50%
  • aaveAave(AAVE)$132.220.27%
  • Pump.funPump.fun(PUMP)$0.004278-2.94%
  • OndoOndo(ONDO)$0.401916-0.83%
  • BlackRock USD Institutional Digital Liquidity FundBlackRock USD Institutional Digital Liquidity Fund(BUIDL)$1.000.00%
  • MemeCoreMemeCore(M)$0.83-3.45%
TradePoint.io
  • Main
  • AI & Technology
  • Stock Charts
  • Market & News
  • Business
  • Finance Tips
  • Trade Tube
  • Blog
  • Shop
No Result
View All Result
TradePoint.io
No Result
View All Result

Celebrating 10 Years Of The S&P 500 Quality Index

August 21, 2024
in Market & News
Reading Time: 4 mins read
A A
Celebrating 10 Years Of The S&P 500 Quality Index
ShareShareShareShareShare

honglouwawa

YOU MAY ALSO LIKE

Stoneridge's Growth Can Take It Higher, Maintain Buy

The blue wave swamped Trump’s redistricting wall – Politico

By George Valantasis

Launched on July 8, 2014, the S&P 500® Quality Index established a framework for identifying high quality companies within the S&P 500. Today, it celebrates a decade of existence as one of the most prominent indices within our factor family. Over the past decade, quality has emerged as a mainstream factor, with significant growth in assets that track the factor. In this blog, we will review the performance of the S&P 500 Quality Index, analyze changes in sector weight and explore the quality characteristics since its inception.

10-Year Performance Review

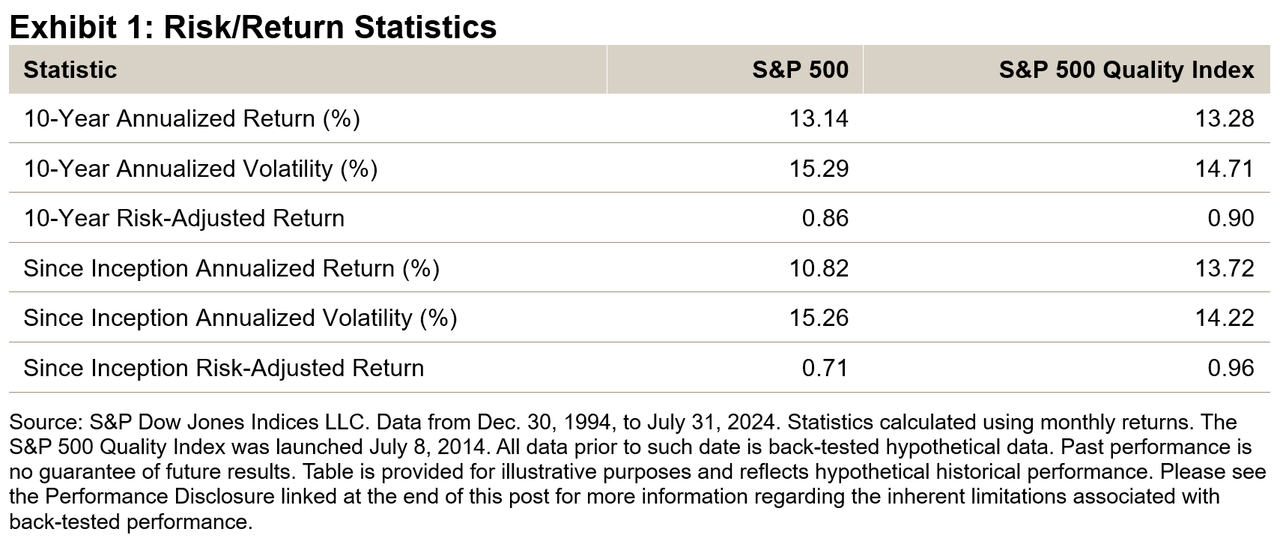
For the 10-year period ending July 31, 2024, the S&P 500 generated a historically strong 13.14% annualized return (see Exhibit 1). Perhaps even more remarkable, however, is the S&P 500 Quality Index’s 13.28% annualized return, considering its defensive attributes that generally result in lower volatility.
Celebrating 10 Years Of The S&P 500 Quality Index

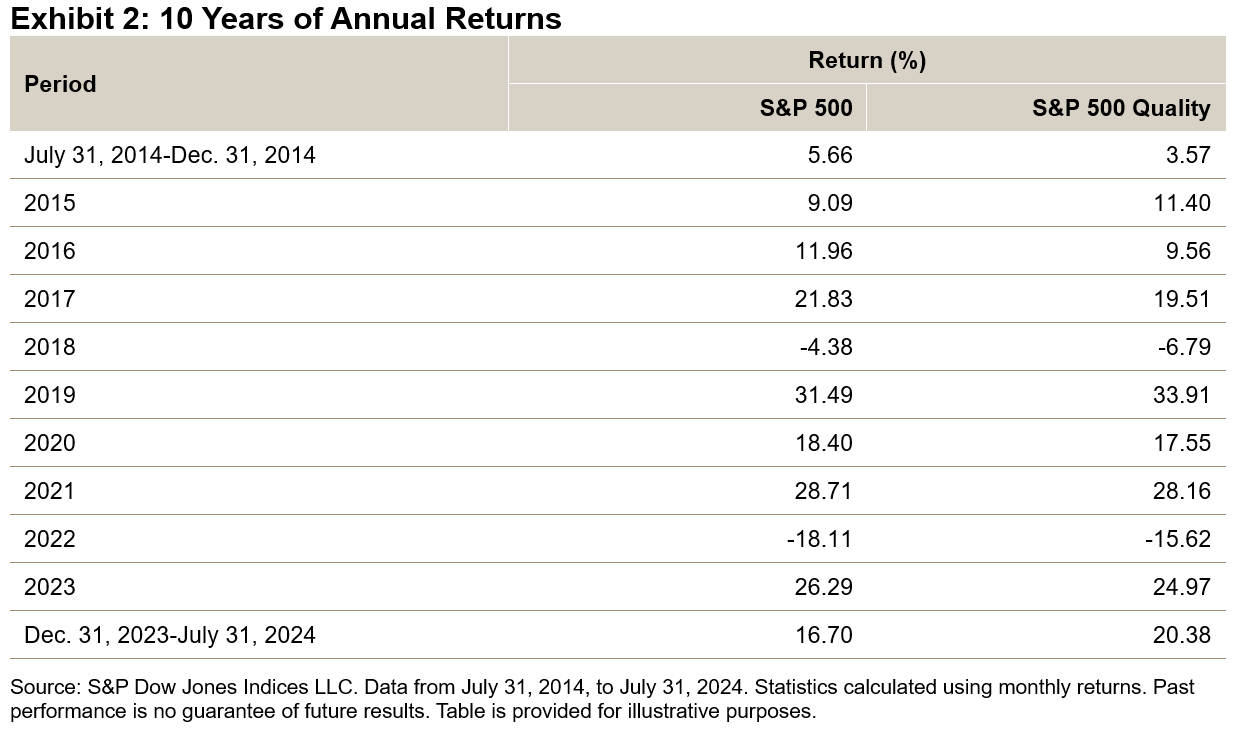
Exhibit 2 displays the annual returns of the S&P 500 and S&P 500 Quality Index since its launch in July 2014. Notably, there have been minimal differences in annual returns over the past decade. However, a significant deviation occurred in the first seven months of this year, with the S&P 500 Quality Index outperforming the S&P 500 by approximately 3.69%.
Celebrating 10 Years Of The S&P 500 Quality Index

Sector Weight

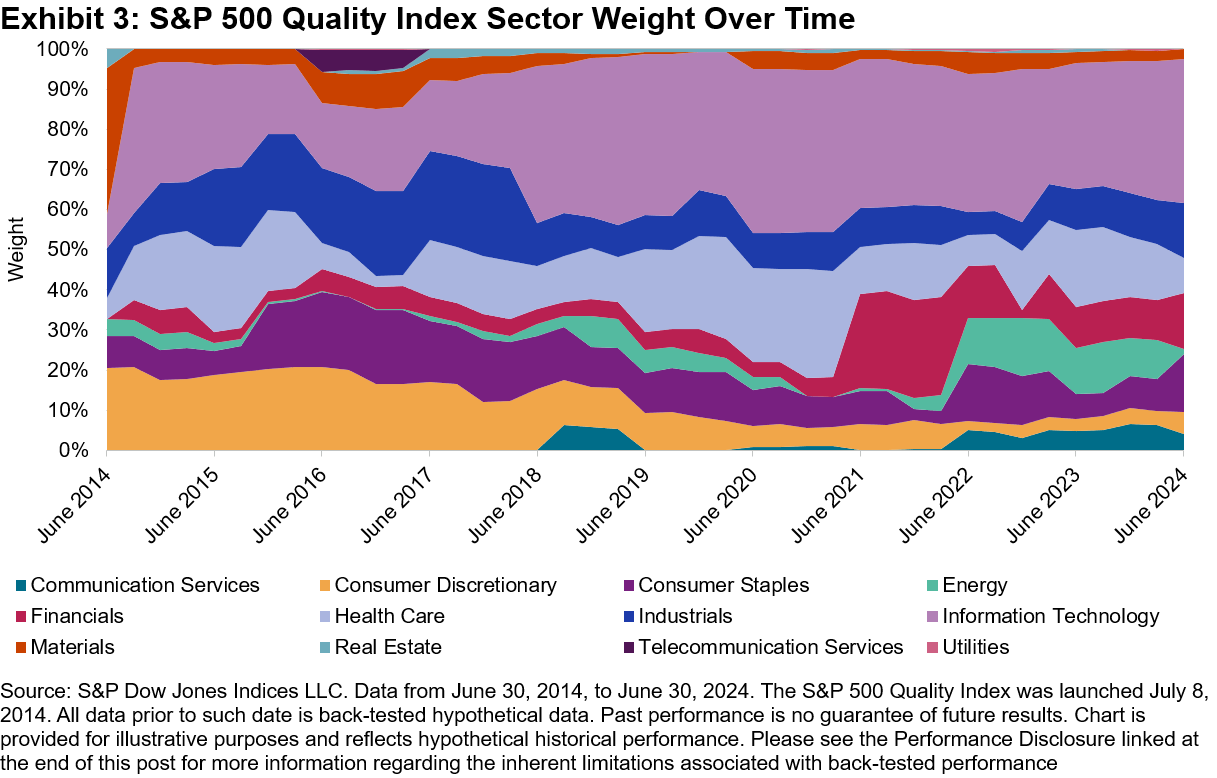
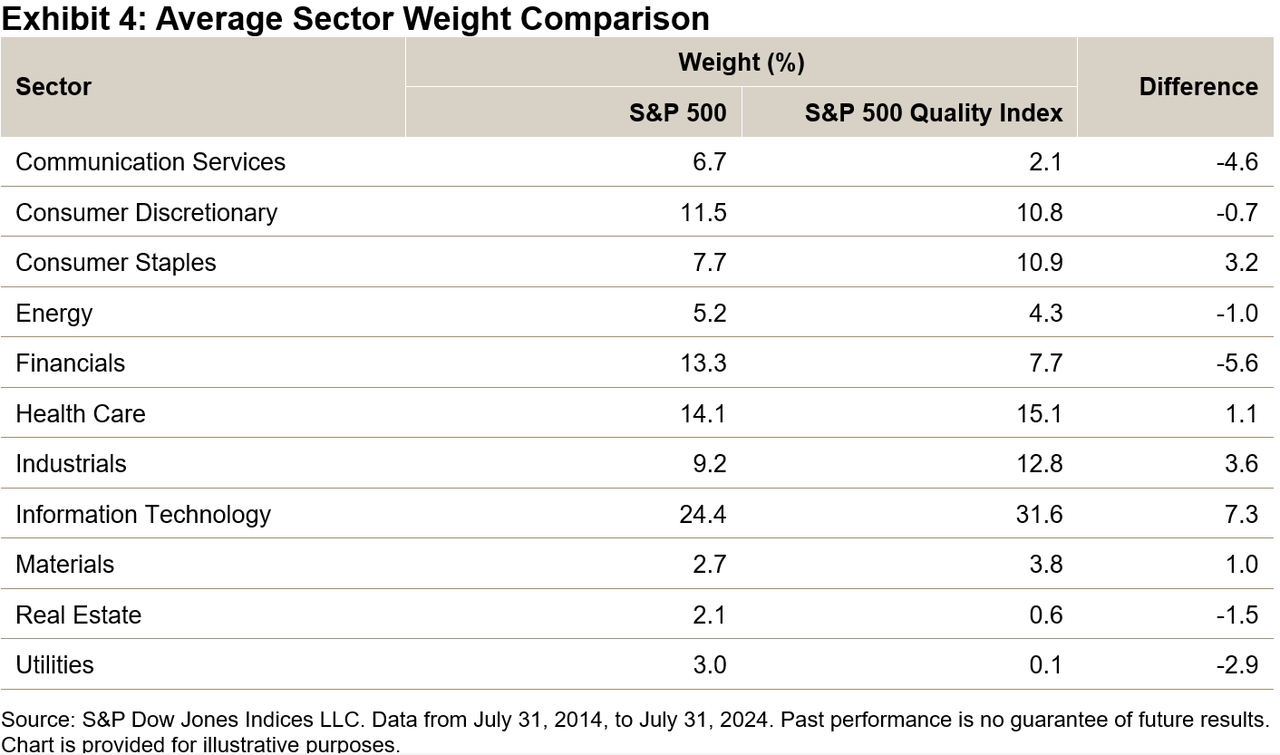
Exhibits 3 and 4 display the sector weights of the S&P 500 Quality Index since its inception. Exhibit 3 shows that the sector weights have been consistent. Information Technology had the highest average sector weight at 31.6%, as well as the largest overweight compared to the S&P 500, with a difference of 7.3%. Financials held the largest underweight relative to the S&P 500 at 5.6%, although it still had an average weight of 7.7% over the 10-year period.
Celebrating 10 Years Of The S&P 500 Quality Index

Quality Metric Comparison: Then versus Now

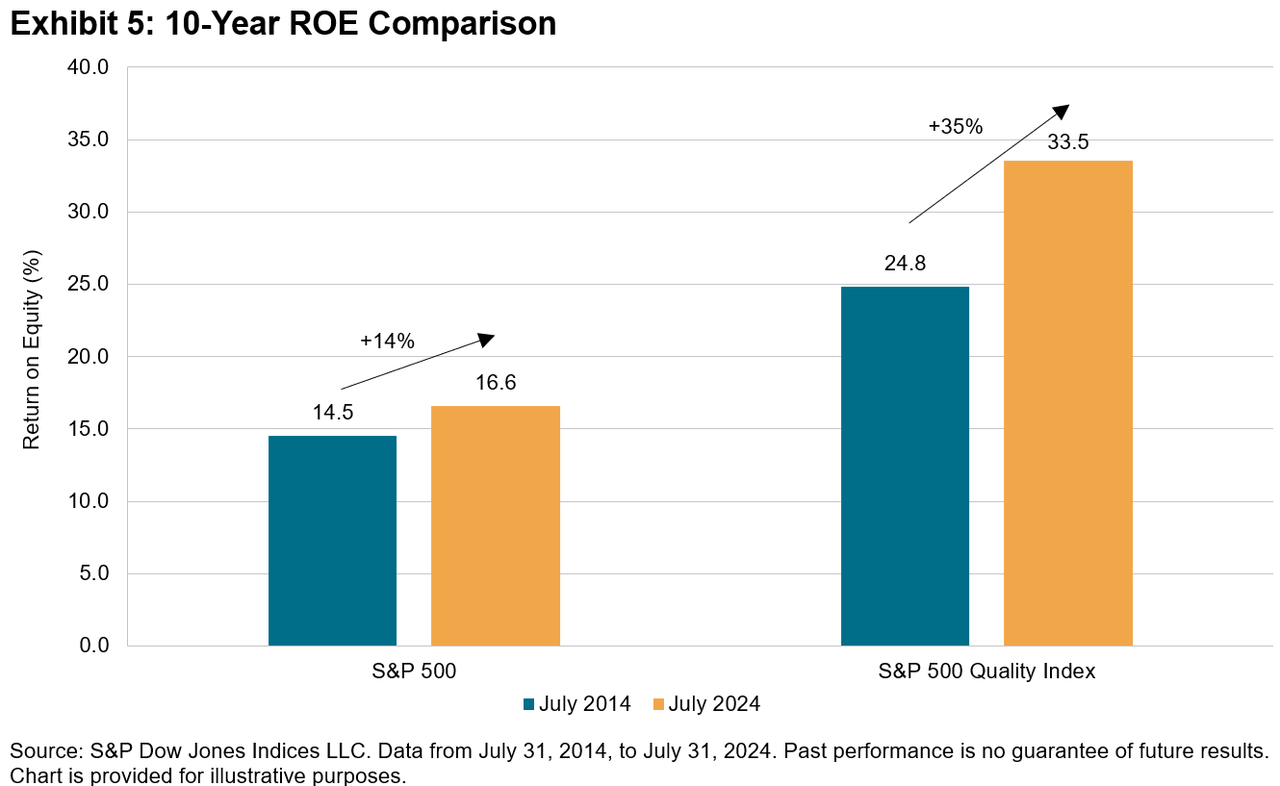
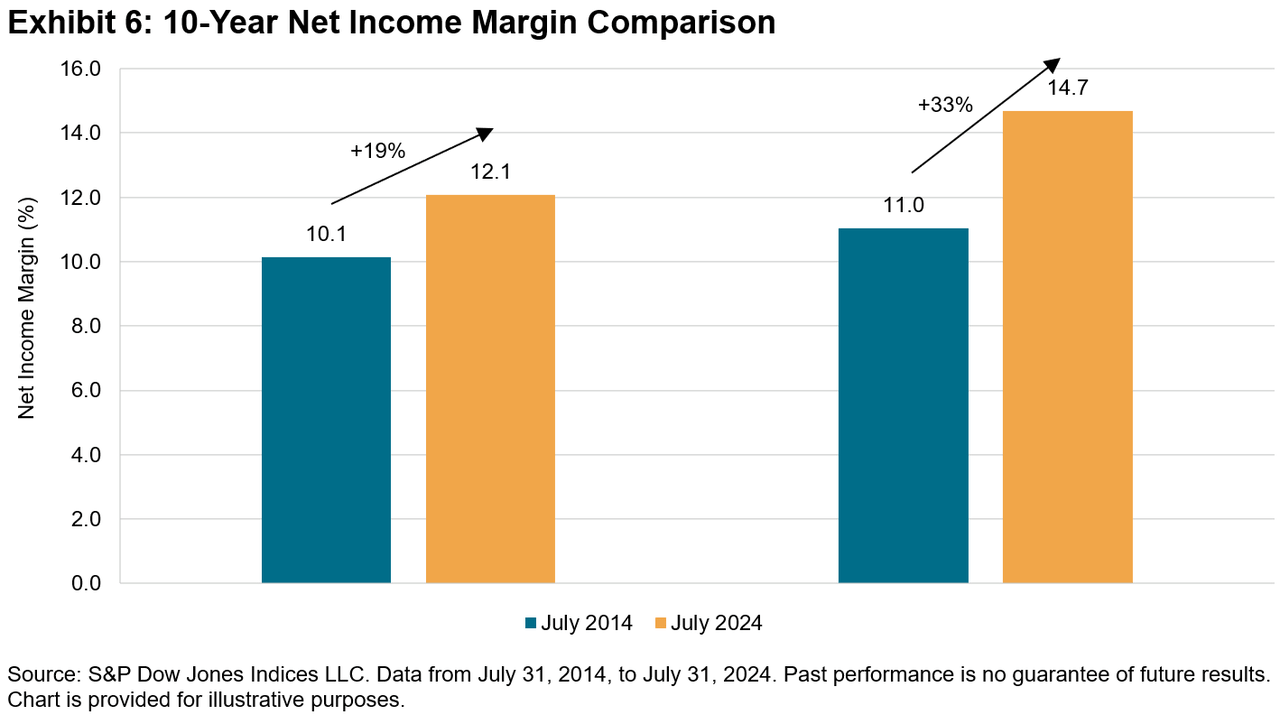
Exhibits 5 and 6 showcase the improved return on equity (ROE) and net income margin of the median constituent of the S&P 500 Quality Index over the last 10 years. The S&P 500 Quality Index’s median constituent increased its ROE from 24.8% to 33.5%, representing a 35% improvement. In comparison, the S&P 500’s median constituent saw a more modest increase in ROE, from 14.5% to 16.6%, representing a 14% improvement. A similar trend is observed in the improvement of net income margin, with the median constituent in the S&P 500 Quality Index improving by 33%, versus 19% for the S&P 500.
Celebrating 10 Years Of The S&P 500 Quality Index

Conclusion

Overall, the S&P 500 Quality Index may have exceeded expectations during the predominantly bullish market conditions of the past decade. The index delivered on expectations of providing defensive characteristics in the form of lower volatility and downside capture. Moreover, it achieved this outperformance without substantial sector differences compared to the S&P 500. Not to mention, the strategy’s quality profile improved over this period as well.

Disclosure: Copyright © 2024 S&P Dow Jones Indices LLC, a division of S&P Global. All rights reserved. This material is reproduced with the prior written consent of S&P DJI. For more information on S&P DJI, please visit S&P Dow Jones Indices. For full terms of use and disclosures, please visit www.spdji.com/terms-of-use.

Original Post

Editor’s Note: The summary bullets for this article were chosen by Seeking Alpha editors.

Credit: Source link

ShareTweetSendSharePin

Related Posts

Stoneridge's Growth Can Take It Higher, Maintain Buy
Market & News

Stoneridge's Growth Can Take It Higher, Maintain Buy

November 5, 2026
The blue wave swamped Trump’s redistricting wall – Politico
Market & News

The blue wave swamped Trump’s redistricting wall – Politico

November 5, 2026
Why Are Bond Yields Climbing?
Market & News

Why Are Bond Yields Climbing?

November 5, 2026
Bob Dylan comes knockin’ on pope’s door as Leo welcomes legend to Vatican – NBC News
Market & News

Bob Dylan comes knockin’ on pope’s door as Leo welcomes legend to Vatican – NBC News

November 5, 2026
Next Post
Morning News NOW Full Broadcast – Aug. 15

Morning News NOW Full Broadcast – Aug. 15

Leave a Reply Cancel reply

Your email address will not be published. Required fields are marked *

Search

No Result
View All Result
LAX Starbucks pricing among steepest airport markups in US

LAX Starbucks pricing among steepest airport markups in US

October 30, 2026
How to Actually Start Investing As Market Crash In 2026?!

How to Actually Start Investing As Market Crash In 2026?!

November 1, 2026
5 Expensive Hobbies Where Owning A 3D Printer Actually Saves You Money

5 Expensive Hobbies Where Owning A 3D Printer Actually Saves You Money

November 1, 2026

About

Learn more

Our Services

Legal

Privacy Policy

Terms of Use

Bloggers

Learn more

Article Links

Contact

Advertise

Ask us anything

©2020- TradePoint.io - All rights reserved!

Tradepoint.io, being just a publishing and technology platform, is not a registered broker-dealer or investment adviser. So we do not provide investment advice. Rather, brokerage services are provided to clients of Tradepoint.io by independent SEC-registered broker-dealers and members of FINRA/SIPC. Every form of investing carries some risk and past performance is not a guarantee of future results. “Tradepoint.io“, “Instant Investing” and “My Trading Tools” are registered trademarks of Apperbuild, LLC.

This website is operated by Apperbuild, LLC. We have no link to any brokerage firm and we do not provide investment advice. Every information and resource we provide is solely for the education of our readers. © 2020 Apperbuild, LLC. All rights reserved.

No Result
View All Result
  • Main
  • AI & Technology
  • Stock Charts
  • Market & News
  • Business
  • Finance Tips
  • Trade Tube
  • Blog
  • Shop

© 2023 - TradePoint.io - All Rights Reserved!