

champpixs
Thesis
2024 is shaping up to be the first year the Fed will cut interest rates, after a violent cycle of rate hikes. On the equity side, large capitalization stocks have benefited from strong balance sheets and funding profiles, and have thus outperformed small caps in the past two years. As the interest rate cycle is about to turn, valuation profiles will start to matter again, and small capitalization equities stand to benefit from lower cost of funds and thus higher earnings per share.
In this article, we are going to have a closer look at the Pacer US Small Cap Cash Cows 100 ETF (BATS:CALF), a small capitalization equities exchange-traded fund:
The Pacer US Small Cap Cash Cows 100 ETF(the “Fund”) is an exchange traded fund that seeks to track the total return performance, before fees and expenses, of the Pacer US Small Cap Cash Cows Index (the “Index”).
The ETF employs a rules-based methodology to screen for the best names in the focus list, and represents a robust choice when screening for small capitalization equities ETFs.
What does the Index do?
As per its literature, the Pacer US Small Cap Cash Cows Index is:
A strategy driven index that aims to provide capital appreciation over time by screening the S&P SmallCap 600® for the top 100 small-cap companies based on free cash flow yield.
The Index therefore chooses the best 100 names from the S&P 600 Small Caps, as identified based on free cash flow metrics:
Stock Selection (Fund Fact Sheet)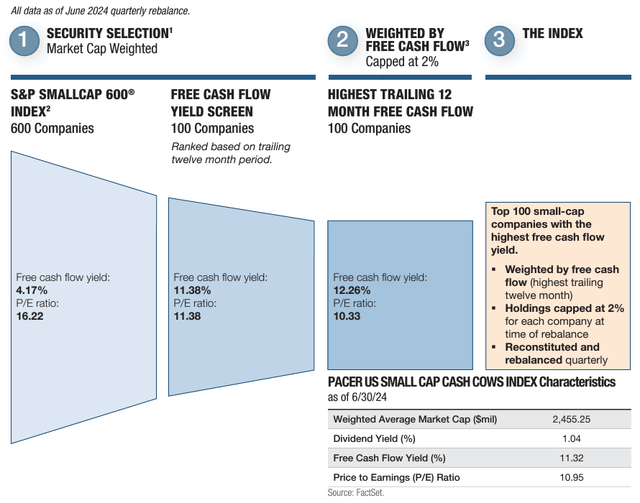
The above visual aid from the ETF’s fact sheet shows how the progression works for the name – the top 100 companies based on FCF are selected, and please notice the valuation differentials. The selected names have a free cash flow yield of 11.38% versus 4.17% for the entire universe. The metric is computed using the highest trailing 12 month free cash flow.
While net income can be affected by many non-cash accounting standards, free cash flow is the ultimate profitability metric:
Key Takeaways. Free cash flow (FCF) is the money a company has left over after paying its operating expenses (OpEx) and capital expenditures (CAPEX). The more free cash flow a company has, the more it can allocate to dividends, paying down debt, and growth opportunities.
Buying into a portfolio of small capitalization stocks with high FCF represents a methodology of buying into profitable names by using a clear cut standard.
High concentration of cyclicals
The index methodology gives us an ETF which is highly concentrated in consumer cyclicals:
Holdings Sectors (Seeking Alpha)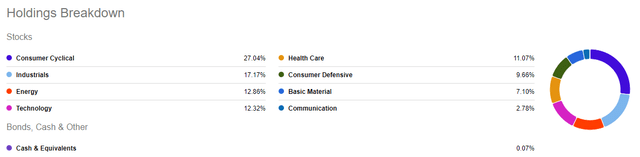
Consumer cyclicals make up 27% of the holdings here, followed by industrials at 17% and energy at 12%. The security selection and build are done from a market cap weighted perspective, and the top 10 names account for roughly 20% of the fund:
Top Holdings (Fund Fact Sheet)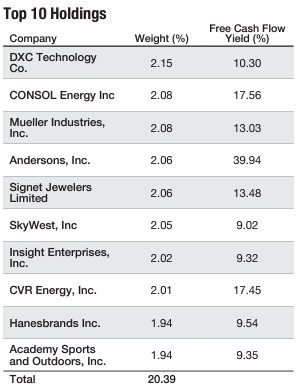
We can see a diverse build in the top 10 names, but a recurring theme in displaying a very large free cash flow yield.
Valuations are very compelling
As the S&P 500 hit another high and printed a P/E ratio above 20x, CALF comes with an 11x P/E ratio. Its over valuation metrics are equally compelling:
Valuation Metrics (Morningstar)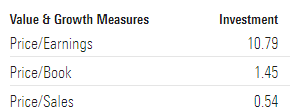
The fund’s Price to Book ratio is 1.45, and its Price to Sales is 0.54. There is tremendous value in small capitalization equities currently, given the lack of capital flow during a rising rates environment. CALF has the ingredients for outperformance if we do get the soft landing the market is pricing in.
Just think about it this way, in terms of upside here – there is scope for both earnings growth for small caps, as well as a re-rating higher to 14x in terms of utilized P/E factor. Both earnings and a re-rating can provide significant upside for the name going forward.
The ETF has done outstandingly well during prior rate cut cycles:
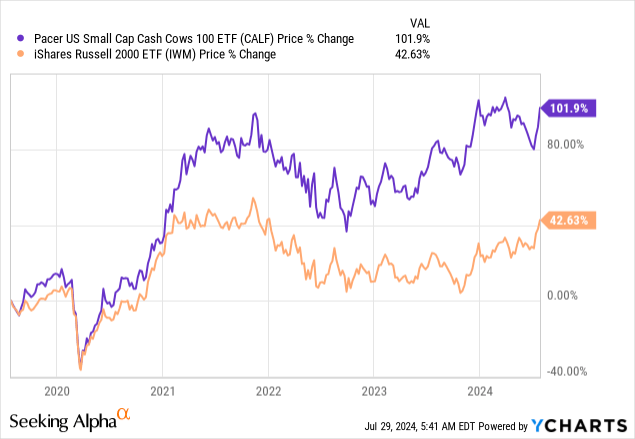
While exposing a drawdown profile similar to the iShares Russell 2000 ETF (IWM) during the Covid crisis, the fund outperformed as rates moved close to zero. Please note that IWM peaked at 40% price appreciation, while CALF went up to 80%. Its rules-based methodology works very well, and the fund is a clear outperformer in a low rates environment.
Risk Factors
Despite its many appealing factors, CALF does not come without any risks. The fund has a large 3-year standard deviation of 22.9%, and an annualized volatility of 19%. The fund’s risk analytics are reflective of the space it generates returns in – small capitalization equities tend to have liquidity issues in major downturns.
The second risk factor to keep in mind is the fund’s overweight positioning in Consumer Cyclicals as a sector. While a soft landing scenario allows the fund to monetize and ride the intrinsic profitability of its chosen equities, a recessionary environment will hit this name hard because cyclicals are prone to severe downturns in recessions. The name will have significant downside if a hard landing does materialize, and we saw the ETF lose -15% in 2022 during the overall risk-off wave.
Conclusion
CALF is equities exchange-traded fund. The vehicle represents an expression of small capitalization stocks in the value sector, with a focus on free cash flow generating enterprises. The fund follows an index which actively screens for the top 100 names in the S&P 600 Small Cap sector, names which have the best FCF metrics.
Through its methodology, CALF is overweight consumer cyclical stocks, which could significantly impair performance during a recession. The fund comes with extraordinary valuation metrics in an 11x P/E ratio and 1.4 P/B figure. In a base case where we have a soft landing with several rate cuts, CALF is set to outperform both via earnings growth and P/E ratio re-rating. In today’s macro environment which is pricing a September 2024 Fed rate cut and a soft landing, CALF represents a tremendously robust opportunity in the small-cap space, a better proposal than IWM in our view.
Credit: Source link