
James Pintar/iStock Editorial via Getty Images
Caesars Entertainment, Inc. (NASDAQ:CZR) operates in the highly competitive hotel and casino industry, along with entering the adjacent rapidly growing online sports betting and iGaming space. This fierce competition, lackluster segment-specific revenue growth trends, and financially restrictive balance sheet have led me to initiate a hold rating for Caesars Entertainment.
Overview
Caesars is a gaming and hospitality company founded in 1973 with the opening of Eldorado Hotel Casino in Reno, Nevada. Caesars has grown through strategic acquisitions, including MTR Gaming Group, Inc. (2014), Isle of Capri Casinos, Inc. (2017), Tropicana Entertainment, Inc. (2018), Caesars Entertainment Corporation (2020), and William Hill PLC (April 22, 2021). This has led to a company that has grown top-line revenue exponentially but consequently has led to significant human capital requirements, capital expenditures, and interest expenses.
According to their recent 2023 Q4 10-K filing, As of December 31, 2023, Caesars owns, leases, or manages 52 properties in 18 states and operates sports wagering in 31 North American jurisdictions, with online sports betting available in 25. Caesars also conducts iGaming in five North American jurisdictions. The company is actively expanding into new markets as regulations permit.
Revenue Segments and Growth
Casino and iGaming
Caesars’ casino operations, comprising approximately ~55% of total net revenues in 2023, involve 51,300 slot machines, 2,700 table games, poker, sports betting [retail and online], and iGaming [online wager-based games].
| 2023 | 2022 | 2021 | |
| Casino Segment Revenue | $6,367 | $5,997 | $5,827 |
| YoY Increase | 6.17% | 2.92% | |
| Total Revenue | $11,528 | $10,821 | $9,570 |
| Percentage of Total Revenue | 55.23% | 55.42% | 60.89% |
| Casino Segment OpEX | $3,342 | $3,526 | $3,129 |
| Total OpEx | $9,056 | $9,082 | $8,110 |
| Percentage of OpEx | 36.9% | 38.82% | 38.58% |
| Margin of Casino Segment [Excludes SGA] | 47.51% | 41.20% | 46.3% |
While 2.92% and 6.17% year-over-year revenue growth in ’22 and ’23 isn’t worthy of waving the white flag, seeing the company be outpaced by their other business segments [touched on later] while the casino industry as a whole grew rapidly does raise concerns. Top retail casino competitors include MGM Resorts International (NYSE: MGM) and Wynn Resorts, Limited (NASDAQ: WYNN). For comparison, MGM saw 6.92% and 41.05% revenue growth in ’22 and ’23 respectively. [’23 fueled largely by MGM China]
Similarly, Caesars has struggled to keep its footing within the online sports betting and iGaming space.
The company operates retail and online sports wagering in 31 North American jurisdictions and iGaming in five.
CZR Q4 23 10K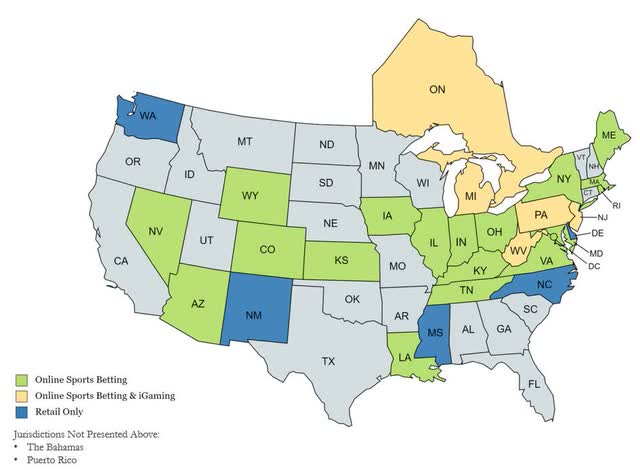
The Caesars Sportsbook app, launched in 2021, and the Caesars Racebook app, introduced in 2022, contribute to the growth in the Caesars Digital segment.
CZR Q4 23 10-K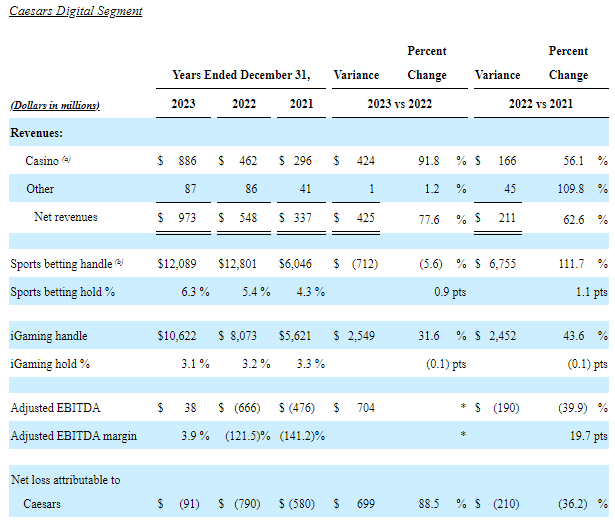
While the growth has certainly been promising, they capture only a fraction of the market and have sports betting hold percentages toward the bottom of the industry at 6.3% in 2023. Top competitors in the online iGaming and sportsbook space include DraftKings Inc (NASDAQ: DKNG) and FanDuel’s parent company Flutter (NYSE: FLUT). For comparison, DraftKings had a 9% hold percentage in Q3 ’23 and 10.4% in Q4 ’23, and the industry average was roughly 9.1%.
If they are unable to grow [and generate profit from] their digital segment, I am worried that the recent flatlining of casino revenue growth will continue. Do I think people will stop visiting Vegas and other regional casinos? No. However, hotel occupancy rates can only go so high and their debt levels have put them in a bind in terms of growth opportunities. I am applying a 5.5% CAGR in this segment.
A potential catalyst for their digital segment is The WSOP brand. As online sports betting and iGaming become more socially accepted, the legalization of online poker could follow suit. This could drive more traffic to their sportsbook and iGaming similar to how DraftKings and FanDuel utilize Daily Fantasy Sports to drive traffic. Not included in the valuation, just food for thought.
Food And Beverage
Food and beverage operations contributed ~15% of total net revenues in 2023. Caesars utilizes a variety of bars, nightclubs, lounges, and upscale eateries, along with providing food pickup and room service options for guests.
| 2023 | 2022 | 2021 | |
| Food and Beverage Segment Revenue | $1,728 | $1,596 | $1,140 |
| YoY Increase | 8.27% | 40% | |
| Total Revenue | $ 11,528 | $ 10,821 | $ 9,570 |
| Percentage of Total Revenue | 14.99% | 14.75% | 11.91% |
| Food and Beverage Segment OpEX | $1,049 | $935 | $707 |
| Total OpEx | $ 9,056 | $ 9,082 | $ 8,110 |
| Percentage of OpEx | 11.58% | 10.30% | 8.72% |
| Margin of Food and Beverage [Excluding SGA] | 39.29% | 41.42% | 37.98% |
While it is promising that Caesars can easily pass on price increases to guests while keeping operating margins high, again, this is just complementary to their casino revenue. For my valuation, I am applying a 6.5% CAGR in this segment.
Hotel Operations
Hotel operations represented ~18% of total net revenues in 2023. Caesars operates 44,700 guest rooms and suites worldwide that operate at various price points. Hotel occupancy rates in the Las Vegas segment have increased from 82.1% in 2021, 92.2% in ’22, and 96.8% in ’23. While promising, leaves little room for improvement.
| 2023 | 2022 | 2021 | |
| Hotel Segment Revenue | $2,090 | $1,957 | $1,551 |
| YoY Increase | 6.80% | 26.18% | |
| Total Revenue | $11,528 | $10,821 | $9,570 |
| Percentage of Total Revenue | 18.13% | 18.09% | 16.21% |
| Hotel Segment OpEX | $570 | $529 | $438 |
| Total OpEx | $9,056 | $9,082 | $8,110 |
| Percentage of OpEx | 6.29% | 5.82% | 5.40% |
| Margin of Hotel Segment [Excluding SGA] | 72.72% | 72.97% | 71.76% |
The long-term average inflation rate for hotels has been 2.95%. I am applying a 4% CAGR in this revenue segment with a 4.75% increase in 2024 to account for the Super Bowl in Q1 of ’24.
Strengths
A major area that Caesars gets right is its ability to diversify its revenue streams while also behaving in a fairly predictable way. Hotel, food + beverage, and casino revenue is all going to trend in a similar trajectory over time, and as long as Caesars can keep occupancy rates high, year-over-year revenue growth will continue.
Their strong brand recognition of both Caesars and the World Series of Poker has the potential to create growth opportunities within the online sports betting and iGaming space in the future.
Current Debt Levels
At first glance, looking at the balance sheet and the declining year-over-year cash since 2020, massive 24.794B net debt, and the income statement’s average of 2.314B in interest expense over the last 3 years, one would, for good reason, have liquidity concerns. However, with over 15B BV in net PPE and management’s commentary regarding utilizing cash flows to deleverage, liquidity isn’t the main problem I have with Caesars. My issue comes from the fact that Caesars has put itself into a bind where deleveraging comes before growth, whereas other competitors continue to take advantage of other rapidly growing markets. [WYNN and MGM internationally, Flutter and DraftKings in the digital segment]
Risks And Limitations
Concerns arise from the company’s current debt levels and limitations, with over $12 billion in outstanding long-term debt and annual rent obligations of $1.3 billion in 2024.
My fear is that in a best-case scenario, Vegas and other regional casinos only have so much room for growth. In a worst-case scenario, revenue growth slows in these segments due to online competition, which may accelerate further sales of properties.
Potential risks include limitations on operating cash flow, flexibility, and competitiveness due to these debt and lease obligations. In addition to this, Caesars has increased vulnerability to market legislation, public health emergencies, industry shifts, and economic downturns. With the rapid expansion of online sports betting and iGaming this could create additional regulation for the industry, negatively impacting Caesars. Finally, exposure to interest rate risk is a notable concern due to variable interest rates on credit facilities.
Valuation
A terminal growth rate of 3.25% and a WACC of 8.177% were used. CAPEX was calculated as a percentage of revenue using historical data, starting at 8% declining over time to 1%. Operating margin was kept consistent at 18.5% utilizing Caesars’ historical numbers.
Combining the revenue growth forecasts of the 3 business segments along with a 5% CAGR to “Other” revenue, a total CAGR is calculated as follows:
Year 1: Casino (55.23%*1.055%) + Food and Bev (14.99%*1.065%) + Hotel (18.13%*1.0475%) + Other (11.65% * 1.05%) = 5.456% Growth
Year 2 – 10: Casino (55.23%*1.055%) + Food and Bev (14.99%*1.065%) + Hotel (18.13%*1.04%) + Other (11.65% * 1.05%) = 5.32% Growth
| 12/31/2024 | 12/31/2025 | 12/31/2026 | 12/31/2027 | 12/31/2028 | 12/31/2029 | 12/31/2030 | 12/31/2031 | 12/31/2032 | 12/31/2033 | Terminal | |
| Revenue | $ 12,156 | $ 12,803 | $ 13,484 | $ 14,202 | $ 14,957 | $ 15,753 | $ 16,591 | $ 17,474 | $ 18,404 | $ 19,383 | $ 19,964 |
| Operating Margin | 18.50% | 18.50% | 18.50% | 18.50% | 18.50% | 18.50% | 18.50% | 18.50% | 18.50% | 18.50% | 18.50% |
| Operating Income | $ 2,249 | $ 2,368 | $ 2,494 | $ 2,627 | $ 2,767 | $ 2,914 | $ 3,069 | $ 3,232 | $ 3,404 | $ 3,585 | $ 3,693 |
| Taxes | $ (472) | $ (497) | $ (523) | $ (551) | $ (581) | $ (612) | $ (644) | $ (678) | $ (715) | $ (753) | $ (775) |
| CAPEX | $ (972) | $ (934) | $ (890) | $ (837) | $ (777) | $ (708) | $ (630) | $ (541) | $ (441) | $ (329) | $ (199) |
| FCFF | $ 804 | $ 936 | $ 1,080 | $ 1,237 | $ 1,408 | $ 1,593 | $ 1,794 | $ 2,012 | $ 2,248 | $ 2,503 | $ 2,718 |
| Present Value | $ 743 | $ 800 | $ 853 | $ 903 | $ 950 | $ 994 | $ 1,035 | $ 1,072 | $ 1,108 | $ 1,140 | $23,904 |
| Total PV of FCF | $ 33,507 |
Enterprise Value: $33,507
Add Cash: 1005
Less Debt: 25,799
Equity Value: 8,713
Shares Outstanding: 216.3
Share Price: $40.28
Utilizing these values, a fair market value of $40.28 is calculated, which is right around the price at the time of writing of $42.41. Given the level of risk associated with the debt levels of the stock and applying a 15% margin of safety to the calculated fair market value, I would not initiate a buy rating of the stock until $34.24.
Conclusion
Caesars has undergone significant growth through acquisitions, leading to diversification across casino, food and beverage, and hotel operations. This expansion has brought along increased human capital requirements, capital expenditures, and interest expenses with debt being added to the balance sheet.
Examining the revenue segments, the casino segment, which comprises over half of total revenues, has shown modest year-over-year growth, raising concerns given the rapid growth in the overall casino industry. The digital segment has struggled to match competitors’ performance. Both of these factors raise concerns about future prospects for the company.
Concerns also arise regarding the limited room for improvement in hotel occupancy rates, potentially impacting future growth.
The stock is fairly valued based on my anticipated future cash flows, leading to a hold rating for the stock. If the stock were to continue its downtrend, I will look into initiating a buy rating around the $34.24 level should it get there.
Credit: Source link