

NicoElNino
I’ve written several articles on Redfin for Seeking Alpha in the past, most recently on August 10, 2022. Since then, other stories were more interesting to me. But when I clicked on “RDFN” yesterday, the stock was up 24%, and a whopping 83% year-to-date. Meanwhile, MGIC, one of my favorite housing stocks, is up a relatively paltry 21%. Best of all, the stock prices are nearly identical – as I write this, MGIC is at $16.01 and Redfin is at $15.23. Value investing pair trades don’t get much better than this – Buy MGIC, sell Redfin.
Value investing comparisons: earnings
Value investing says that I seek ownership in a company to gain rights to its earnings. Just as I don’t buy a restaurant because it’s got a nice chart or to squeeze the shorts, value investors don’t buy stocks because they are disruptive or have momentum. They buy for earnings. That makes sense so that’s how I invest.
The return on your investment in a stock can therefore be measured by its EPS-to-price ratio (E/P instead of the usual P/E). MGIC is expected to earn $2.14 per share this year (all EPS estimates from Seeking Alpha), or a 14% earnings yield. Redfin is expected to lose $1.19 per share, for a (7%) earnings yield. Using calculus, I learned that 14% beats (7%). Using advanced statistics, I learned that 14% beats (7%) by a lot.
Maybe next year will be different? Nope. MGIC is expected to earn $2.24 per share, Redfin another loss, this time ($0.99).
Value investing comparisons: book value
A company’s book value gives us two different angles on a company apart from earnings. One is its liquidation value if the company shuts down today. The other information is a history of prior earnings results. Spoiler alert – this doesn’t come out well for Redfin.
First, book value per share, which is a liquidation value estimate. MGIC’s book value is $4.8 billion, or $16.57 per share. Redfin has all of $21 million of equity (yes, you read that right), or $0.18 per share. And according to Wall Street, MGIC will be adding nicely to its book value through next year while Redfin’s book value probably turned negative this past Q2.
But, you may say:
- Redfin has a frequently viewed website, averaging 50 million users per month. That asset is not factored into its book value. Yes, but MGIC has $292 billion of insurance in force that is not factored into its book value.
- MGIC is a heavily levered financial company. Yes, it has $662 million of debt, or 14% of equity. Yes, but Redfin has $952 million of debt, equal to 4533% of equity.
Prior earnings (less dividends paid and shares repurchased) is summarized in a company’s retained earnings balance sheet line. MGIC’s retained earnings is $4.1 billion, and that includes horrific subprime mortgage losses during the ’07-’11 housing bust. Redfin’s retained earnings are negative $754 million. The company has been around for 21 years, and to my knowledge has never earned money; certainly not since 2015.
Value investing comparisons: market share
MGIC is far from a disruptor. Its mortgage insurance business model is very similar to its peers. As a result, MGIC’s market share – its mortgages insured as a percent of mortgage debt outstanding – has been stable, with a slight upward bias:
MGIC financial reports, the Federal Reserve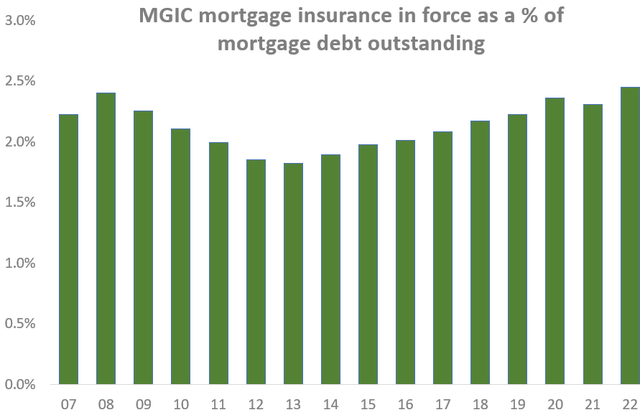
Sources: MGIC financial reports, Federal Reserve
Not an exciting growth story, right. But Redfin, with all those website users and its disruptor claims, must be a real growth story, right? Here are its market share numbers – the percent of national home sales that it brokers. You tell me:
Redfin financial reports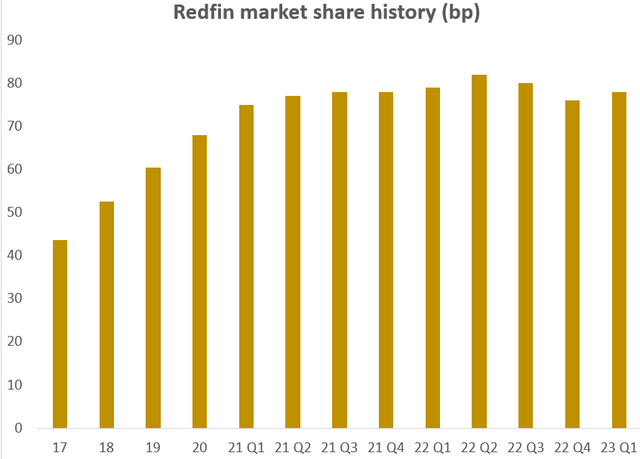
Source: Redfin financial reports
Like other “disruptors”, Redfin’s market share growth came with impressive earnings losses. Now that management has supposedly seen the light and is creating a “path to profitability”, the expense cuts and price increases have eroded some market share.
Redfin’s stock price implies strong and sustained growth that will drive its EPS to much higher levels than MGIC in some distant future. The above charts give no evidence of that.
Value investing comparisons: the near-term housing outlook
Redfin’s powerful rally on July 11 was not accompanied by news specific to the company; no company press release and nothing was reported on Seeking Alpha. The only related news was this from Seeking Alpha on the Zillow Group:
“The stock climbed 5.5% in Tuesday premarket trading after Piper Sandler upgraded the digital real estate stock to Overweight from Neutral as share gains and improving macroeconomic conditions set up a better near-term outlook for the company… ‘Home sales growth likely troughed last quarter.'”
Fannie Mae agrees about the existing home sales, as this history and Fannie Mae’s forecast shows:
Fannie Mae housing forecasts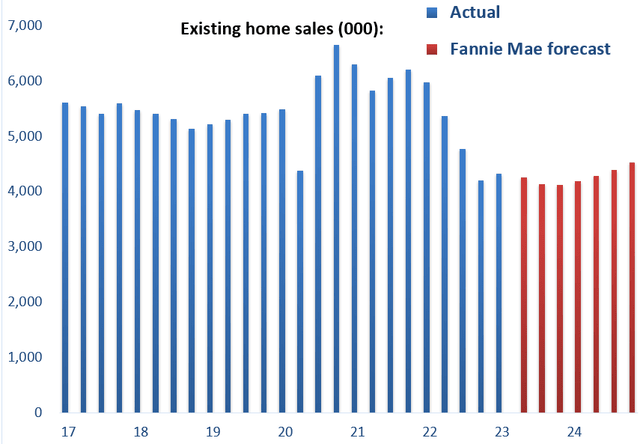
Source: Fannie Mae reports
So existing home sales – Redfin’s product – have likely hit bottom, but the expected recovery is expected to be anemic. Why? Redfin itself gave the answer in a June 14 press release:
“More than nine of every 10 U.S. homeowners with mortgages have an interest rate below 6%, according to a new report from Redfin…Homeowners holding onto their comparatively low mortgage rates is the main reason for today’s major shortage of new listings. Here’s the full breakdown:
- Below 5%: 82.4% have a rate below 5%.
- Below 4%: 62% have a rate below 4%.
- Below 3%: 23.5% an interest rate below 3%.”
This fact is bad news for Redfin and other realtors. And bad news for mortgage bankers, which is another Redfin business. Unless interest rates plunge, home sales and home mortgage originations will stay sub-par, not just through 2024 but for years thereafter.
But these low-rate mortgages are great for MGIC and its peers. Something really bad has to happen to a family’s cash flow to get them to default on their 3% or 4% home mortgage. So MGIC will be able to retain the insurance on these low-risk mortgages for many years.
More reasons to buy MGIC
I’ve already noted that MGIC is selling at an attractive 14% earnings yield and only 96% of its book value, plus a large chunk of its insurance in force is at very low interest rates. All great stuff. But there’s more! Things like:
- Probably its best credit quality ever – MGIC is on a pace to record about $40 million of paid insurance claims this year. That compares to $577 million in 2004, in the heart of the housing bubble.
- A huge amount of excess capital – $2.4 billion of excess over the $3.5 billion required by regulation.
- Lots of free cash flow going to shareholders – MGIC paid out 60% of its earnings to shareholders since the start of 2021, in the form of dividends and share repurchases. It is very possible that the payout ratio will rise over the next few years, because of the large amount of excess capital and because mortgage debt growth has slowed a lot, so MGIC won’t need to retain much capital to support growth.
- Recession protection from reinsurance – Over 80% of MGIC’s insurance risk has some reinsurance protection.
- A bottoming in insurance premiums – A consequence of MGIC’s strategy of conservative underwriting and reinsurance has been that MGIC’s average insurance premium declined for many years. But a bottom is near because the strategy is nearly fully implemented. EPS will grow faster after that happens.
- Higher interest rates will gradually increase the yield on MGIC’s $5.6 billion investment portfolio – If interest rates stay near the current level for a few years, higher investment yields will add 2% per year to EPS growth.
That’s enough reasons. Make MGIC your housing play, not Redfin.
Credit: Source link