Barry Lewis/In Pictures via Getty Images
This issue of Where Fundamentals Meets Technicals takes a look at the unloved energy sector.
We combine my fundamental analysis with the technical analysis of Zac Mannes and Garrett Patten in these types of reports to find intersections between the two disciplines. And occasionally we make one public, like this one.
Lyn Alden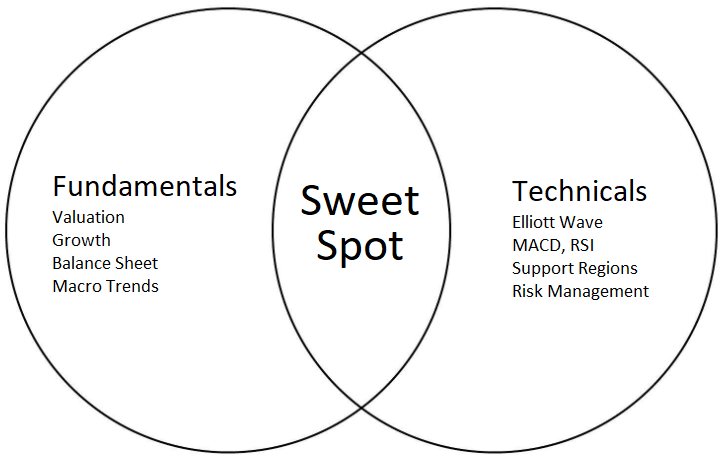
I view the energy sector as one of the most interesting areas of the market at this time for several reasons. First, it’s out of favor. Second, it’s cheap and profitable. Third, there are signs of economic re-acceleration. Fourth, it can hedge right-tail risks for a portfolio.
Reason 1) It’s Out of Favor
The energy sector had a big burst of outperformance in 2022, followed by a lackluster 2023, and now it’s off of most investors’ radar in 2024 even though it is showing signs of life. Today’s main theme is instead AI; that’s where everyone wants to invest, and mostly for good reason.
Several large cap energy stocks like Exxon Mobil (XOM) have record high short interest. It’s a low ratio in absolute terms and thus insufficient to cause any sort of mechanical short squeeze, but it gives an idea of where sentiment is.
YCharts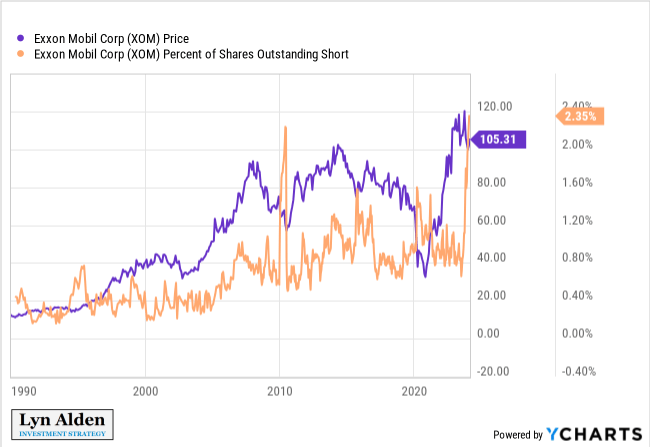
In terms of technicals, Zac Mannes sees the bottom likely being in for the energy sector (NYSEARCA:XLE), with probabilities pointing to good performance over the next year. I like owning multiple energy equities because it spreads out the risk between different geographies.
Zac Mannes, Stock Waves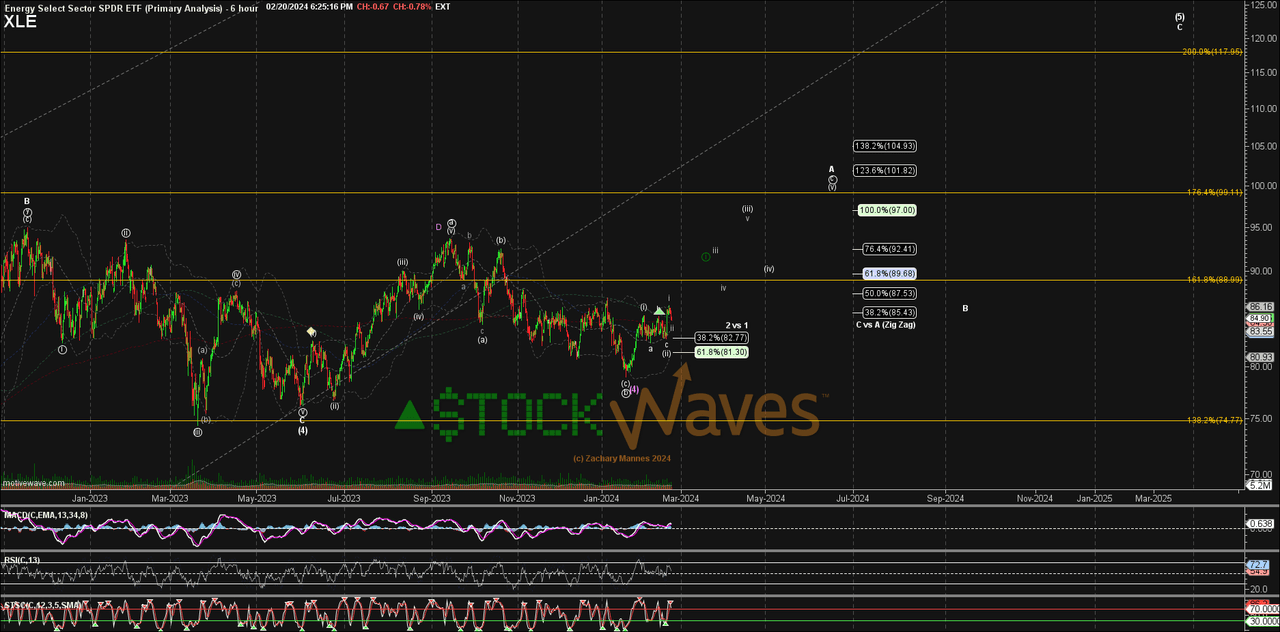
Now, since I focus on fundamentals rather than technicals, I don’t really have a firm view on what it will do over any given 6-12 month period. That will mostly depend on market sentiment and human decisions. But this makes for a decent stop-loss point from a trading perspective. If the XLE ETF firmly breaks below its recent low of $80, then that might be a time to stop and reassess the long thesis until price action improves once again.
Reason 2) It’s Cheap and Profitable
Large cap energy producers with long-lived reserves are generally in great shape fundamentally. The big companies, like Exxon Mobil and Chevron (CVX) have very high AA- credit ratings, which indicate some of the strong balance sheets around.
They’ve locked in low interest rates on long duration corporate bonds, and they hold significant cash-equivalents with interest rates that adjust upward with Fed rate hikes, putting them in the opposite duration mismatch position of a typical bank.
The top-tier American energy majors can be purchased for under 12x earnings. They have above average dividend yields, safe payout ratios, and decades of consecutive annual dividend growth. Investors willing to buy Canadian or European energy majors can often find them trading at earnings multiples of well under 10x.
FAST Graphs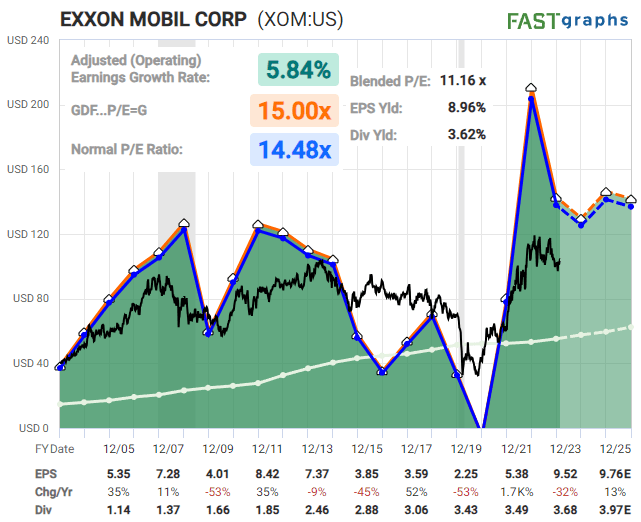
Reason 3) There are Signs of Economic Re-Acceleration
For the past two years, the United States’ economy has been decelerating by many metrics. This means that while growth has remained positive, the rate of that growth has been slowing, and some sectors have been in outright contraction.
The problems in the commercial real estate industry are well-known, but manufacturing has also been in a slump. However, early signs of stabilization and possible re-acceleration are beginning to emerge, and should be monitored closely.
YCharts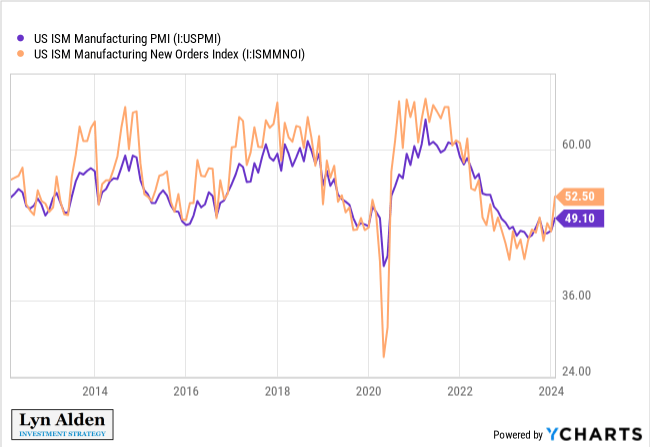
Energy prices, like anything else, are based on supply and demand. The supply side is determined by industry trends, OPEC+ decisions, and occasional supply disruptions. The demand side is driven largely by the state of the global economy, especially in rate-of-change terms.
Demand has been suppressed lately from property deleveraging in China, de-industrialization in Europe, weak manufacturing in the United States, and currency crisis in several frontier markets. If these trends begin to stabilize and re-accelerate, with a rising manufacturing PMI in the United States and an up-tick of fiscal stimulus and asset price support in China, then the market could find itself very lopsided on its low energy positioning.
Reason 4) It Can Hedge Right-Tail Risks
For the past four decades of structural disinflation and growth, the 60/40 portfolio has been ideal for many investors. During economic expansions stocks do well, and during economic contractions bonds do well.
However, during less common inflationary periods of history, that type of portfolio doesn’t work very well, and there can be long stretches of time where neither stocks or bonds do well in real terms. In those environments, energy and other commodities tend to be among the few strong performers.
This is because during disinflationary eras, most of the risks are “left-tail”, meaning that economic slumps and high debt levels can sharply weigh down the economy. On the other hand, during inflationary eras, there are more “right-tail” risks, meaning that the economy can overheat sharply and contribute to higher-than-expected input costs and interest rates.
When we imagine how stocks might have a weak year or two and wish to protect against that risk, we can think of a couple main scenarios.
The first scenario is from the left tail, meaning that the Fed’s current hawkishness, along with the weakness in the commercial real estate sector, might weigh down the economy enough and cause a weak labor market that feeds on itself into a recession. Holding significant cash-equivalents (BIL) or dollar exposures (UUP) may protect against that scenario.
The second scenario is from the right tail, meaning that ongoing fiscal deficits could keep the economy hotter than expected, energy prices and wage prices could incline upward, and the Fed could stay higher for longer. And ironically by staying higher for longer, they feed into even larger fiscal deficits by causing higher public interest expense. Alternatively, there are always risks of supply disruptions given the ongoing geopolitical tensions globally that could trigger risks from the right tail. Holding some energy producers can protect against some of these sorts of risks.
Overall, in addition to companies in the energy sector offering decent fundamentals in their own right from a value investing perspective, I currently view them as positive-carry forms of protection against these sorts of right-tail risks emerging. Energy majors are profitable at current oil prices and pay you to own them, but then they also can shoot up if sharply higher energy prices emerge and threaten other portfolio assets.
Credit: Source link