
William_Potter
Investment Thesis
Risk management plays a crucial role in determining long-term investment success, with strategic portfolio allocation being a key component in the risk management process.
In today’s article, I will show you how you could allocate the amount of $100,000 among 2 ETFs and 20 dividend income companies that I consider to be attractive options to invest in during this month of December.
I will conduct a comprehensive risk analysis of this dividend portfolio to illustrate how it achieves a reduced risk level, thereby enhancing the probability of positive investment outcomes for investors who adopt a long-term investment approach.
This investment portfolio not only offers an attractive Weighted Average Dividend Yield [TTM] of 3.84%, but it also provides investors with extensive diversification over companies, sectors, and industries, in addition to geographical diversification. It is further worth highlighting that this dividend portfolio prioritizes large-cap companies with a focus on value, further underscoring its reduced risk level.
The reduced risk level of the portfolio is further demonstrated by the attractive Valuations of the companies (13 of the 20 have a P/E [FWD] Ratio below 20), their strong Profitability (15 of the 20 have a Net Income Margin above 10%), and their relatively safe dividends (16 of the 20 have a Payout Ratio below 60%).
These are the 10 high dividend yield companies that I believe are worth considering an investment in during this month of December and which are part of this dividend portfolio:
- Allianz SE (OTCPK:ALIZY)(OTCPK:ALIZF).
- Altria Group, Inc. (NYSE:MO).
- AT&T Inc. (NYSE:T).
- Banco Santander, S.A. (NYSE:SAN).
- Morgan Stanley (NYSE:MS).
- Petróleo Brasileiro S.A. – Petrobras (NYSE:PBR).
- Pfizer Inc. (NYSE:PFE).
- The Kraft Heinz Company (NASDAQ:KHC).
- United Parcel Service, Inc. (NYSE:UPS).
- Verizon Communications Inc. (NYSE:VZ).
These are the 10 dividend growth companies that I have selected for the month of December and which are also part of this dividend portfolio:
- Comcast Corporation (NASDAQ:CMCSA).
- PepsiCo, Inc. (NASDAQ:PEP).
- The Toronto-Dominion Bank (NYSE:TD)(TSX:TD:CA).
- Restaurant Brands International Inc. (NYSE:QSR).
- UnitedHealth Group Incorporated (NYSE:UNH).
- BlackRock, Inc. (NYSE:BLK).
- Apple Inc. (NASDAQ:AAPL).
- Microsoft Corporation (NASDAQ:MSFT).
- Visa Inc. (NYSE:V).
- Bank of America Corporation (NYSE:BAC).
Overview of the Selected Companies/ETFs of This Dividend Portfolio
|
Company |
Sector |
Industry |
Country |
Market Cap |
Dividend Yield [FWD] |
Dividend Yield [TTM] |
Payout Ratio |
Dividend Growth 3 Yr [CAGR] |
Dividend Growth 5 Yr [CAGR] |
P/E [FWD] |
Net Income Margin |
24M Beta |
Allocation |
Amount in $ |
|
|
ALIZF |
Allianz SE |
Financials |
Multi-line Insurance |
Germany |
99.01B |
4.99% |
4.99% |
55.88% |
6.58% |
5.72% |
11.61 |
8.04% |
0.73 |
4% |
4000 |
|
MO |
Altria Group, Inc. |
Consumer Staples |
Tobacco |
United States |
73.86B |
9.39% |
9.10% |
76.77% |
3.98% |
5.85% |
9.1 |
42.60% |
0.42 |
4% |
4000 |
|
T |
AT&T Inc. |
Communication Services |
Integrated Telecommunication Services |
United States |
116.55B |
6.81% |
6.81% |
44.76% |
-10.93% |
-5.97% |
7.33 |
-9.29% |
0.57 |
3% |
3000 |
|
SAN |
Banco Santander, S.A. |
Financials |
Diversified Banks |
Spain |
66.57B |
4.15% |
3.65% |
27.44% |
9.56% |
-9.64% |
6.16 |
23.63% |
1 |
2% |
2000 |
|
MS |
Morgan Stanley |
Financials |
Investment Banking and Brokerage |
United States |
128.93B |
4.33% |
4.14% |
55.11% |
32.41% |
24.19% |
13.99 |
18.37% |
1.04 |
4% |
4000 |
|
PBR |
Petróleo Brasileiro S.A. – Petrobras |
Energy |
Integrated Oil and Gas |
Brazil |
96.68B |
9.80% |
4.56% |
33.87% |
54.84% |
– |
4.01 |
25.53% |
0.2 |
3% |
3000 |
|
PFE |
Pfizer Inc. |
Healthcare |
Pharmaceuticals |
United States |
169.84B |
5.45% |
5.45% |
56.79% |
4.43% |
4.95% |
18.74 |
15.29% |
0.55 |
4% |
4000 |
|
KHC |
The Kraft Heinz Company |
Consumer Staples |
Packaged Foods and Meats |
United States |
43.03B |
4.61% |
4.61% |
52.63% |
0.00% |
-8.54% |
13.69 |
11.00% |
0.28 |
3% |
3000 |
|
UPS |
United Parcel Service, Inc. |
Industrials |
Air Freight and Logistics |
United States |
129.74B |
4.26% |
4.26% |
64.25% |
17.06% |
12.23% |
18.05 |
9.19% |
1.02 |
4% |
4000 |
|
VZ |
Verizon Communications Inc. |
Communication Services |
Integrated Telecommunication Services |
United States |
158.75B |
7.04% |
6.95% |
54.41% |
1.98% |
2.02% |
8.45 |
15.58% |
0.38 |
3.5% |
3500 |
|
BLK |
BlackRock, Inc. |
Financials |
Asset Management and Custody Banks |
United States |
112.53B |
2.64% |
2.63% |
53.66% |
11.90% |
11.78% |
20.93 |
30.66% |
1.52 |
4% |
4000 |
|
AAPL |
Apple Inc. |
Information Technology |
Technology Hardware, Storage and Peripherals |
United States |
2.95T |
0.51% |
0.50% |
15.36% |
5.57% |
6.15% |
28.96 |
25.31% |
1.24 |
3% |
3000 |
|
MSFT |
Microsoft Corporation |
Information Technology |
Systems Software |
United States |
2.74T |
0.81% |
0.76% |
26.70% |
10.11% |
10.16% |
33.07 |
35.31% |
1.14 |
3% |
3000 |
|
V |
Visa Inc. |
Financials |
Transaction & Payment Processing Services |
United States |
510.98B |
0.82% |
0.73% |
21.35% |
15.30% |
16.27% |
26.11 |
52.90% |
0.97 |
3% |
3000 |
|
BAC |
Bank of America Corporation |
Financials |
Diversified Banks |
United States |
243.90B |
3.11% |
2.99% |
25.21% |
8.51% |
11.24% |
9.12 |
31.52% |
1.14 |
4% |
4000 |
|
CMCSA |
Comcast Corporation |
Communication Services |
Cable and Satellite |
United States |
173.40B |
2.69% |
2.65% |
28.86% |
8.20% |
9.40% |
11.98 |
12.53% |
0.79 |
2% |
2000 |
|
PEP |
PepsiCo, Inc. |
Consumer Staples |
Soft Drinks & Non-alcoholic Beverages |
United States |
235.30B |
2.99% |
2.92% |
64.31% |
7.12% |
6.63% |
22.88 |
9.05% |
0.48 |
3.5% |
3500 |
|
TD |
The Toronto-Dominion Bank |
Financials |
Diversified Banks |
Canada |
108.78B |
4.95% |
4.68% |
47.11% |
7.18% |
6.88% |
11.02 |
22.67% |
0.91 |
4% |
4000 |
|
QSR |
Restaurant Brands International Inc. |
Consumer Discretionary |
Restaurants |
Canada |
32.54B |
3.01% |
2.99% |
68.01% |
2.06% |
7.02% |
25.11 |
13.22% |
0.59 |
2% |
2000 |
|
UNH |
UnitedHealth Group Incorporated |
Healthcare |
Managed Healthcare |
United States |
507.12B |
1.37% |
1.33% |
29.05% |
14.71% |
16.14% |
23.1 |
6.02% |
0.45 |
2% |
2000 |
|
SCHD |
Schwab U.S. Dividend Equity ETF |
ETF |
ETF |
United States |
3.67% |
13.05% |
20% |
20000 |
|||||||
|
DVY |
iShares Select Dividend ETF |
ETF |
ETF |
United States |
3.80% |
5.95% |
15% |
15000 |
|||||||
|
3.84% |
7.66% |
100% |
100,000 |
Source: The Author, data from Seeking Alpha
Risk Analysis of This Dividend Portfolio
In the following, I will conduct a comprehensive risk analysis of this dividend portfolio to demonstrate that it showcases a reduced risk level, ensuring to increase the probability of positive investment outcomes.
Risk Analysis: Analyzing the Companies’ Valuations
The chart below illustrates the current Valuations of the 20 selected companies, underscoring the reduced risk level of this dividend portfolio: 13 of the 20 selected companies have a P/E [FWD] Ratio below 20, indicating that their share prices are not inflated by unrealistic growth expectations.
Source: The Author, data from Seeking Alpha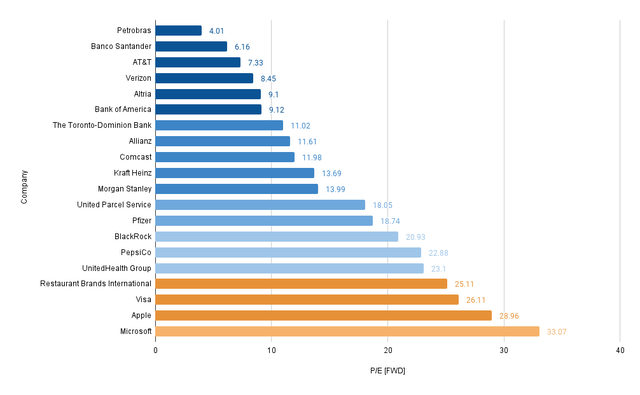
The graphic further shows that only four of the 20 selected picks have a P/E [FWD] Ratio above 25: Restaurant Brands International (P/E [FWD] Ratio of 25.11), Visa (26.11), Apple (28.96), and Microsoft (33.07).
In my opinion, their elevated P/E [FWD] Ratio does not represent an elevated risk factor for investors due to the attractive growth rates these companies have shown in recent years: Their 3-Year EPS Diluted Growth Rates [CAGR] stand at 16.25% (Restaurant Brands International), 19.23% (Visa), 23.18% (Apple), and 18.52% (Microsoft).
These metrics underscore my investment thesis that the selected companies have an attractive Valuation and that this dividend portfolio provides investors with a reduced risk level.
Risk Analysis: Analyzing the Companies’ Profitability
The graphic below showcases the companies’ strength in terms of Profitability.
15 of the 20 selected companies have a Net Income Margin above 10%. Nine of the 20 have a Net Income Margin above 20%.
Only one company (AT&T) has a negative Net Income Margin (-9.29%). These metrics underline the portfolio’s reduced risk level while confirming my strategy to not overweight the AT&T stock in this dividend portfolio.
Source: The Author, data from Seeking Alpha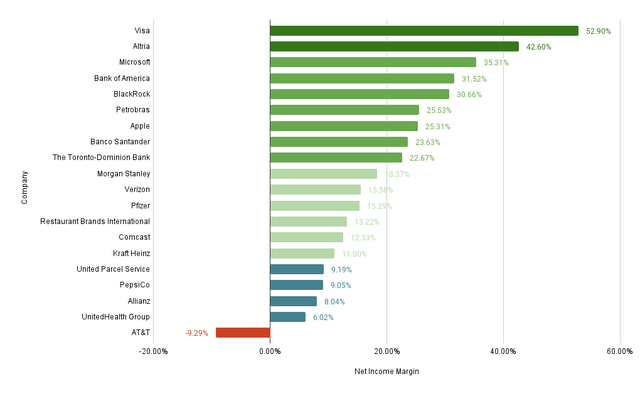
Risk Analysis: Analyzing the Sustainability of the Companies’ Dividend
The chart below illustrates that 16 of the 20 selected dividend paying companies exhibit a Payout Ratio below 60%, suggesting a reduced likelihood of a dividend reduction.
A lower risk of dividend cuts implies that there is a decreased probability of a stock price decline of one of these companies.
Source: The Author, data from Seeking Alpha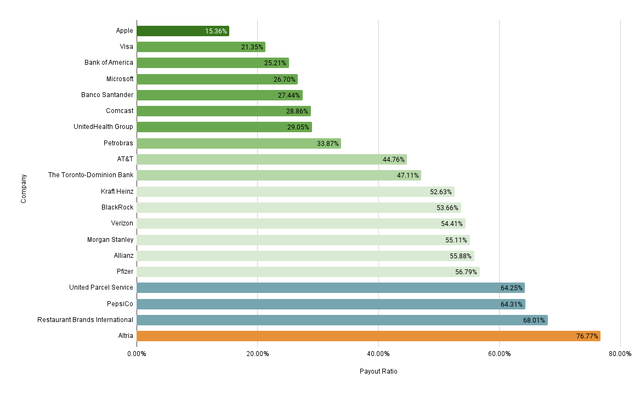
The only companies with a Payout Ratio above 60% are United Parcel Services (Payout Ratio of 64.25%), PepsiCo (64.31%), Restaurant Brands International (68.01%), and Altria (76.77%).
It is worth highlighting that all four companies with a Payout Ratio above 60% display a 3-Year EPS Diluted Growth Rate [CAGR] exceeding 5%. This suggests a reduced likelihood of dividend cuts, even among those companies with higher Payout Ratios.
United Parcel Service’s 3-Year EPS Diluted Growth Rate [CAGR] stands at 23.38%, PepsiCo’s at 5.89%, Restaurant Brands International’s at 16.25%, and Altria’s at 133.69%.
The reduced likelihood of a dividend cut of one of these companies further underlines the portfolio’s reduced risk level, indicating the elevated chances of obtaining attractive investment outcomes.
Risk Analysis of the Portfolio Allocation per Company/ETF
Schwab U.S. Dividend Equity ETF (SCHD), comprising 20% of the overall portfolio, and iShares Select Dividend ETF (DVY), accounting for 15%, constitute the largest allocations within this dividend portfolio.
This strategic allocation not only ensures an extensive diversification and reduced risk level, it also lays a solid foundation for achieving an attractive Weighted Average Dividend Yield. The Dividend Yields [TTM] of the ETFs stand at 3.67% and 3.80% respectively.
Illustration of the Portfolio Allocation per Company/ETF
Source: The Author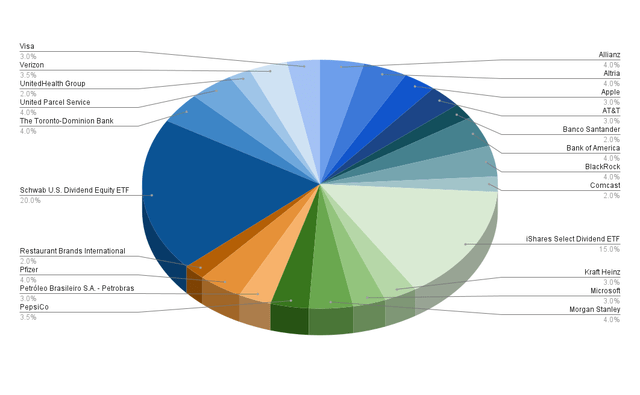
Companies with the Largest Proportion of the Overall Portfolio
- Allianz SE (4%).
- Altria Group, Inc. (4%).
- Bank of America Corporation (4%).
- BlackRock, Inc. (4%).
- Morgan Stanley (4%).
- Pfizer Inc. (4%).
- The Toronto-Dominion Bank (4%).
- United Parcel Service, Inc. (4%).
The companies mentioned above have the largest proportion in relation to the overall investment portfolio. These companies are not only attractive in terms of risk and reward, but they also pay attractive Dividend Yields, thus ensuring to increase the portfolio’s Weighted Average Dividend Yield.
The chart below illustrates the Dividend Yield [FWD] of the companies, which account for the largest proportion of the overall portfolio.
Source: The Author, data from Seeking Alpha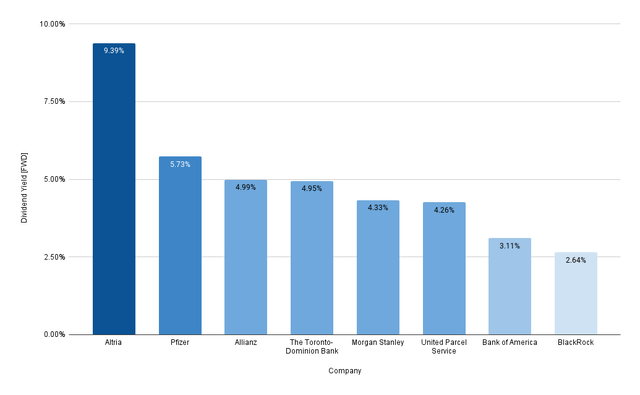
Companies with the Lowest Proportion of the Overall Portfolio
- Banco Santander, S.A. (2%)
- Comcast Corporation (2%)
- Restaurant Brands International (2%)
The above companies are underrepresented in this dividend portfolio due to their associated higher risk, as seen with Banco Santander, less attractive growth perspective like with Comcast (with a Revenue Growth Rate [FWD] of 2.01%), or elevated Payout Ratios like Restaurant Brands International (with a Payout Ratio of 68.01%).
Risk Analysis of the Company-Specific Concentration Risk When Allocating SCHD and DVY Across the Companies They Are Invested In
The graphic below demonstrates the portfolio’s diversification across companies when allocating Schwab U.S. Dividend Equity ETF and iShares Select Dividend ETF to the companies they are invested in.
The chart illustrates the largest 25 individual positions of this dividend portfolio. It is worth highlighting that the companies which represent less than 1% of the overall portfolio are indirect investments via Schwab U.S. Dividend Equity ETF and/or iShares Select Dividend ETF.
Source: The Author, data from Seeking Alpha and Morningstar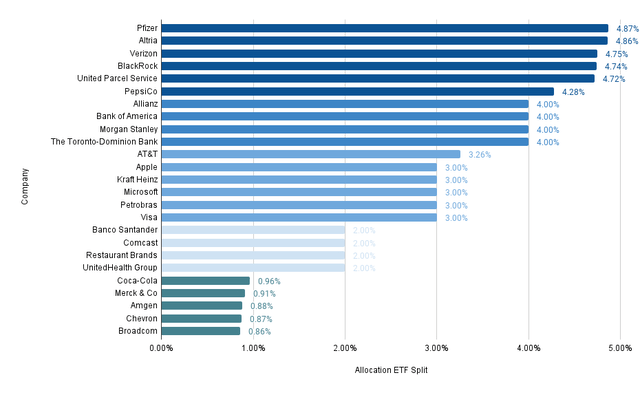
By distributing the investments of both ETFs among their constituent companies, no single position exceeds 5% of the overall dividend portfolio. This careful selection process and portfolio construction strategy ensures a reduced company-specific concentration risk for this dividend portfolio.
Only six of the 20 selected companies account for more than 4% of this dividend portfolio: Pfizer (with a proportion of 4.87%), Altria (4.86%), Verizon (4.75%), BlackRock (4.74%), United Parcel Service (4.72%), and PepsiCo (4.28%).
It is also worth mentioning that four of the six largest positions have a 24M Beta Factor below 1, indicating that they can reduce portfolio volatility while underscoring the portfolio’s reduced risk level: Pfizer’s 24M Beta Factor stands at 0.55, Altria’s at 0.42, Verizon’s at 0.39, and PepsiCo’s at 0.48.
The remaining companies represent 4% or less in relation to the overall portfolio, indicating a reduced company-specific concentration risk and therewith a reduced overall risk level for this dividend portfolio.
Risk Analysis of the Portfolio’s Sector-Specific Concentration Risk
The ETF Sector represents the largest sector of this dividend portfolio, accounting for 35% of the overall portfolio. This sector is represented by Schwab U.S. Dividend Equity ETF (accounting for 20% of the portfolio), and by iShares Select Dividend ETF (15%).
The second largest is the Financial Sector, which makes up 25% of the overall portfolio. The Financials Sector is represented by Allianz (4%), Bank of America (4%), BlackRock (4%), Morgan Stanley (4%), The Toronto-Dominion Bank (4%), Visa (3%), and Banco Santander (2%).
The third largest is the Consumer Staples Sector with 10.5%, represented by Altria (4%), PepsiCo (3.5%), and Kraft Heinz (3%).
The Communication Services Sector is the fourth largest with 8.5%, made up of Verizon (3.5%), AT&T (3%), and Comcast (2%).
The Information Technology Sector is the fifth largest, accounting for 6%. The Sector is represented by Apple and Microsoft, which account for 3% each.
The Healthcare Sector is also represented with 6% of the overall portfolio (Pfizer and AbbVie accounting for 3% each).
The Industrials Sector (represented by United Parcel Service with 4%), the Energy Sector (with Petrobras representing 3%), and the Consumer Discretionary Sector (with Restaurant Brands International representing 2%), account for a smaller percentage in comparison to the overall portfolio.
The fact that only the ETF Sector accounts for more than 25% of the overall portfolio can be interpreted as another indicator of its reduced risk level, even though the Financials Sector’s relatively large share indicates some degree of sector-specific concentration risk.
Source: The Author, data from Seeking Alpha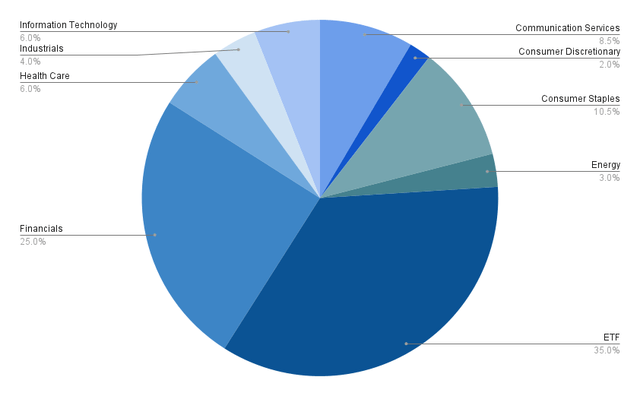
ETFs (35%)
- Schwab U.S. Dividend Equity ETF (20%).
- iShares Select Dividend ETF (15%).
Financials Sector (25%)
- Allianz (4%).
- Bank of America (4%).
- BlackRock (4%).
- Morgan Stanley (4%).
- The Toronto-Dominion Bank (4%).
- Visa (3%).
- Banco Santander (2%).
Consumer Staples (10.5%)
- Altria (4%).
- PepsiCo (3.5%).
- Kraft Heinz (3%).
Communication Services (8.5%)
- Verizon (3.5%).
- AT&T (3%).
- Comcast (2%).
Information Technology (6%)
- Apple (3%).
- Microsoft (3%).
Healthcare (6%)
- AbbVie (3%).
- Pfizer (3%).
Industrials (4%)
- United Parcel Service (4%).
Energy (3%)
Consumer Discretionary (2%)
- Restaurant Brands International (2%).
Risk Analysis of the Portfolio’s Sector-Specific Concentration Risk When Allocating SCHD and DVY Across the Sectors They Are Invested In
The chart below shows the portfolio allocation per sector when allocating Schwab U.S. Dividend Equity ETF and iShares Select Dividend ETF across the sectors they are invested in.
Source: The Author, data from Seeking Alpha and Morningstar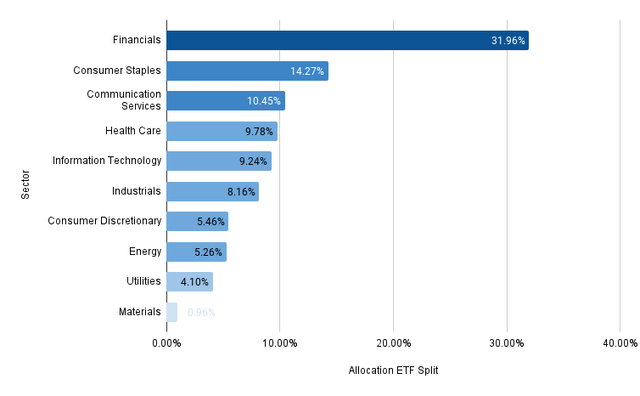
The graphic demonstrates some sector-specific concentration risk, due to the large exposure to the Financials Sector, which represents 31.96% of the overall portfolio.
However, the chart also illustrates that all other sectors account for less than 15% of the overall portfolio.
The second largest is the Consumer Staples Sector, accounting for 14.27% of the overall portfolio, and the third largest is the Communication Sector, representing 10.45%.
It is worth noting that all other sectors account for less than 10% of the overall portfolio.
These Sectors include the Healthcare Sector (with 9.78% of the portfolio), the Information Technology Sector (with 9.24%), the Industrials Sector (with 8.16%), the Consumer Discretionary Sector (with 5.46%), the Energy Sector (with 5.26%), the Utilities Sector (4.10%), and the Materials Sector (0.96%).
Risk Analysis of the Industry-Specific Concentration Risk
The illustration below shows the portfolio allocation per industry. Only the ETF Industry accounts for a larger proportion of the overall investment portfolio (representing 35%).
Source: The Author, data from Seeking Alpha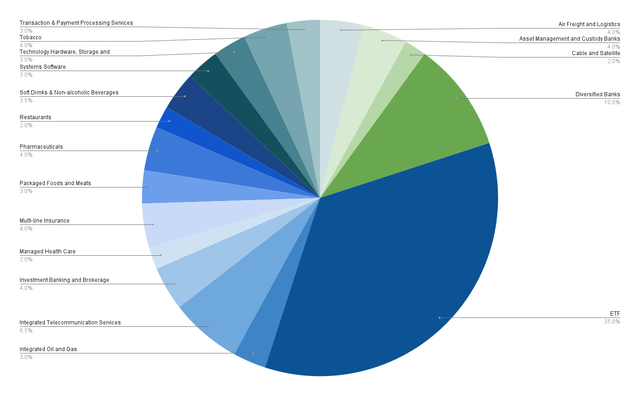
The largest Industry besides the ETF Industry is the Diversified Bank Industry, representing 10% of the overall portfolio. The Diversified Bank Industry is represented by Bank of America (4%), The Toronto-Dominion Bank (4%), and Banco Santander (2%).
The third largest Industry is the Integrated Telecommunication Services Industry with 6.5%, represented by Verizon (3.5%), and AT&T (3%).
All other Industries account for less than 5% of the overall portfolio, underlying the reduced industry-specific concentration risk of this dividend portfolio.
Risk Analysis of the Portfolio Allocation per Country
85% of this dividend portfolio comprises U.S.-based companies, while the remaining 15% consists of companies that are based outside the United States.
Among the selected companies, 6% are Canadian (The Toronto-Dominion Bank with 4% and Restaurant Brands International with 2%). 4% are German (represented by Allianz), 3% are Brazilian (Petrobras), and 2% are Spanish (Banco Santander).
Source: The Author, data from Seeking Alpha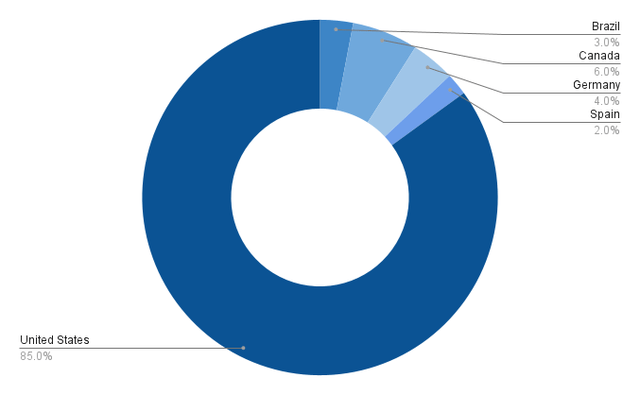
This allocation shows that this dividend portfolio reaches some degree of geographical diversification, while focusing on the U.S. market, underscoring the lower risk profile of this dividend portfolio.
Risk Analysis of The Equity Style of This Dividend Portfolio
The graphic below demonstrates that the majority of the selected companies are large-cap companies (81%), while 16% are mid-cap companies, and 3% are small-cap companies.
Given that large-cap companies carry a lower level of risk when compared to mid-cap companies and small-cap companies (reflected in their reduced volatility), the portfolio’s lowered risk level is further evidenced.
It can also be noted that 60% of the selected companies can be defined as value companies, while 8% are growth companies and 32% are core companies (that combine both value and growth).
The strong focus on value further underscores the portfolio’s reduced risk level.
It is also worth highlighting that 47% of all companies in this portfolio are large-cap companies with a focus on value, once again evidencing the reduced risk level and an increased likelihood for investors achieving positive investment outcomes.
Source: The Author, data from Seeking Alpha and Morningstar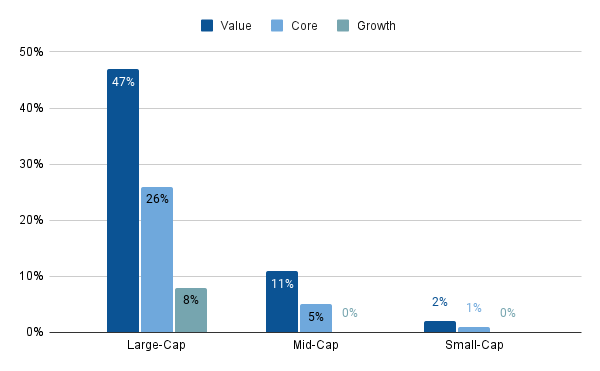
Conclusion
The dividend portfolio I have presented in today’s article, offers investors an extensive diversification across companies, sectors, and industries, while also offering a notable degree of geographical diversification.
By distributing the investments of both ETFs (Schwab U.S. Dividend Equity ETF and iShares Select Dividend ETF) among their constituent companies, no individual company accounts for more than 5% of the overall portfolio, indicating a reduced company-specific concentration risk.
The companies’ relatively low Valuations (13 of the selected 20 have a P/E [FWD] Ratio below 20), their relatively strong Profitability (15 of the 20 have a Net Income Margin above 10%), and their relatively safe dividends (16 of the 20 have a Payout Ratio below 60%), further strengthen my confidence that the portfolio provides investors with a reduced risk level, thus increasing the likelihood of positive investment results.
This dividend portfolio offers investors an attractive Weighted Average Dividend Yield [TTM] of 3.84% and a 5-Year Weighted Average Dividend Growth Rate [CAGR] of 7.66%, indicating that it could generate an attractive extra income for you and a relatively strong potential for future dividend enhancements.
In case you aim to further lower the portfolio’s risk level, you could decrease its sector-specific concentration risk, since the Financials Sector represents a relatively large share of the overall portfolio (31.96% when allocating the ETFs across the sectors they are invested in).
To mitigate this risk, you could add an additional ETF, which would ensure an even broader diversification. Alternatively, you could add companies from other sectors than the Financials Sector. For example, you could add a Real Estate Investment Trusts, since presently no company from the Real Estate Sector is included in the portfolio.
Another option to further decrease the portfolio’s risk level would be to include fixed income assets, thereby ensuring reduced portfolio volatility.
In this extensively diversified dividend portfolio, you could even include a company with a higher risk level (such as Tesla, Inc. (TSLA), for example).
However, when doing so, I suggest underweighting Tesla (or any other company with a similarly high risk level), providing the company with a maximum of 2.5% of the overall portfolio, given Tesla’s elevated Valuation. The company’s high P/E [FWD] Ratio of 76.56 indicates that high growth expectations are priced into the company’s stock price, which would significantly increase the risk level of this portfolio if the company had a disproportionally high share.
This strategy ensures that you maintain a reduced risk level for the portfolio, maximizing the likelihood of obtaining attractive investment outcomes when staying committed to a long-term investment approach.
With the implementation of The Dividend Income Accelerator Portfolio, I am following a similar investment approach when compared to the portfolio I have presented today.
The Dividend Income Accelerator Portfolio presently provides investors with an attractive Weighted Average Dividend Yield of 4.69%, an appealing 5-Year Weighted Average Dividend Growth Rate [CAGR] of currently 9.03%, and a reduced risk level, ensuring an increased probability of positive investment results, aiming to optimize returns for investors.
Editor’s Note: This article discusses one or more securities that do not trade on a major U.S. exchange. Please be aware of the risks associated with these stocks.
Credit: Source link