

Richard Drury
In this article, we catch up on the BDC Blue Owl Capital Corp III (NYSE:OBDE) and discuss its latest quarterly result. We also highlight the announced merger with its sister BDC Blue Owl Capital Corp (OBDC) and why it is a good result for OBDE. For the quarter, OBDE and OBDC delivered a total NAV return of 2.1% – slightly below the average so far in the sector.
We have covered the previous earnings release here. We rate the stock a Buy rating as the fundamentals have remained stable, but the merger provides a valuation catalyst.
OBDE industry focus is in Tech, Insurance and Healthcare – fairly typical non-cyclical sector overweights. OBDE trades at a 11.5% total dividend yield and a 9% discount to book.
OBDE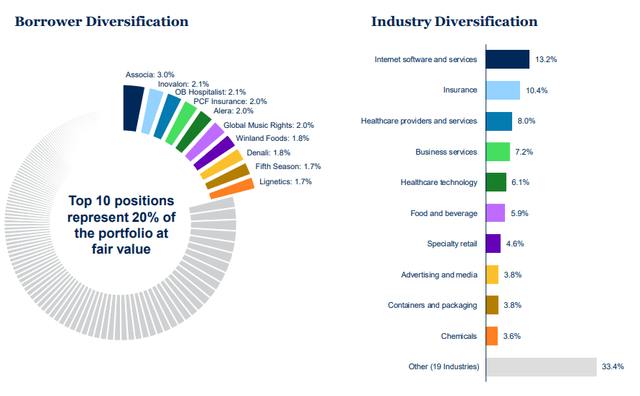
Merger Catalyst
There are several positives for OBDE in the merger proposal. For one, the stock has been trading at a lower valuation than OBDC of 5-6% in absolute terms, currently trading at a 4% lower valuation. In the base case scenario of the NAV for NAV merger, this is the likely uplift for OBDE shares if the resulting company continues to trade at the OBDC valuation – which we expect given OBDC’s larger size and stronger market “brand”.
The relative valuation uplift for OBDE is reduced the higher the valuation of OBDC goes however the absolute return would be very strong in that result as the small relative reduction happens in light of a big absolute rise in price. The base case scenario is the simple NAV-for-NAV exchange (left-most scenario below).
OBDE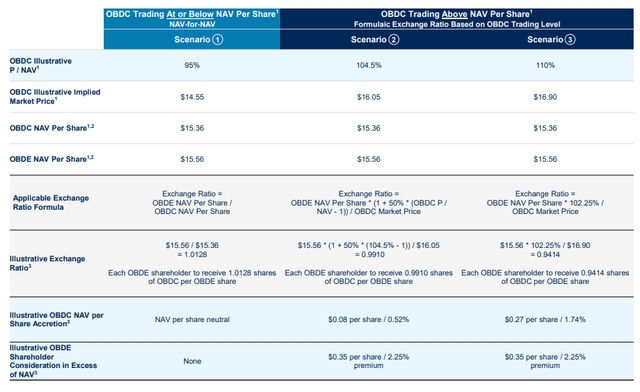
The second positive factor for OBDE in light of the merger is the potential waiving of the last lock-up expiry if the merger is closed before 24-Jan of next year (the date of the last lock-up expiry). The first lock-up expiry delivered a sharp drop to the price as shown below. Cancelling the last lock-up expiry should support the price. The October lock-up expiry looks to be on track, however, and could deliver another attractive entry point as well. Its impact is unlikely to be as large as the first one, however, due to greater liquidity after the first lock-up expiry and the merger plan.
Systematic Income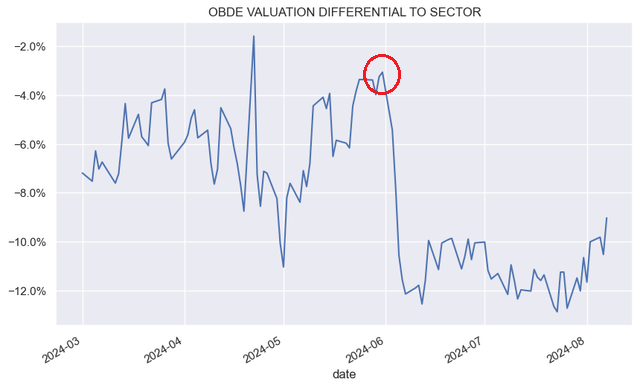
Another benefit to OBDE is the lower level of interest expense in OBDC as well as a higher level of portfolio yield. This is why the net investment income yield of OBDC is 2.1% higher than that of OBDE. Net investment income of the merged entity should be slightly below that of OBDC, but well above the OBDE level.
Systematic Income BDC Tool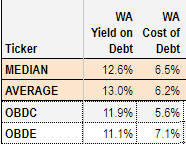
Two small downsides are worth highlighting. One is the higher level of non-accruals in OBDC and a lower first-lien allocation. This, arguably, makes for a less “safe” portfolio. However, there are two mitigants. One is that the loss rate for OBDC is quite low at 0.14% annualized and two, an equity allocation also provides upside. Apart from some differences in allocation weights, the portfolios of the two BDCs are very similar. About 90% of investments in OBDE are also in OBDC. The illustration below highlights the key metrics of the two portfolios.
OBDE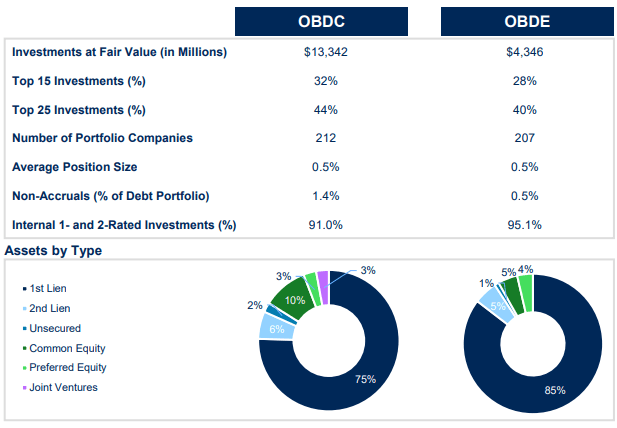
Management estimates there would be around $5m of expenses saved by the combined entity, potentially boosting net investment income by roughly 2%. The advisor will also pay up to $4.25m in merger expenses.
Overall, this is a good result for OBDE and shareholders should support the merger in our view.
Quarter Update
Net investment income ticked higher by over 4% to $0.41. This was the biggest jump in the sector so far and well above the average 0.7% quarterly fall. That said, we expected a bigger rise, as the previous quarter’s net income was weighted down by the one-off exchange listing fee.
Systematic Income BDC Tool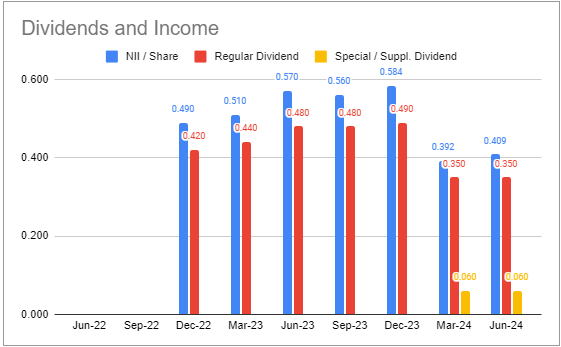
The company declared a $0.35 base dividend, unchanged from the previous quarter, as well as a $0.06 special dividend. The special dividend is part of a series of 5 previously declared dividends. This works out to a total dividend yield on NAV of 10.6%. Special dividends are fairly common for BDCs like OBDE with lock-up expires and are intended to increase demand and support the stock price. If the merger goes ahead, OBDE shareholders will likely see a pick-up in dividend yield as OBDC features a higher distribution rate on NAV.
The NAV fell 0.6% (OBDC NAV fell 0.7%). This was due primarily to the fact that the company’s total dividend is on par with its net investment income (itself due to the special dividend highlighted above). Most BDCs maintain total dividend coverage well above 100% and this retained income supports the NAV.
OBDE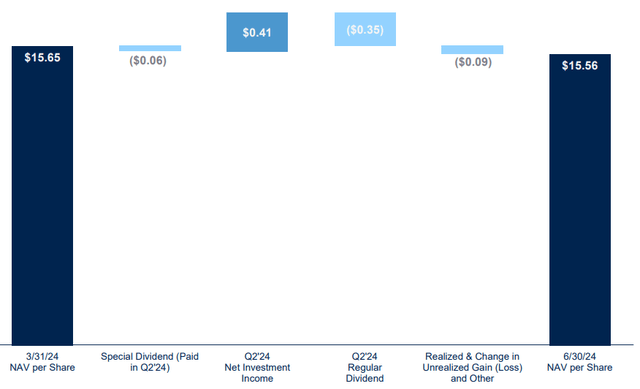
This was the first NAV drop since mid-2022.
Systematic Income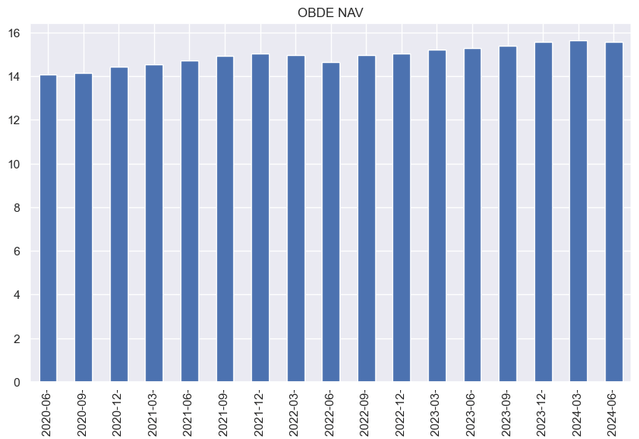
Net new investments were very high for both BDCs (OBDE shown below).
Systematic Income BDC Tool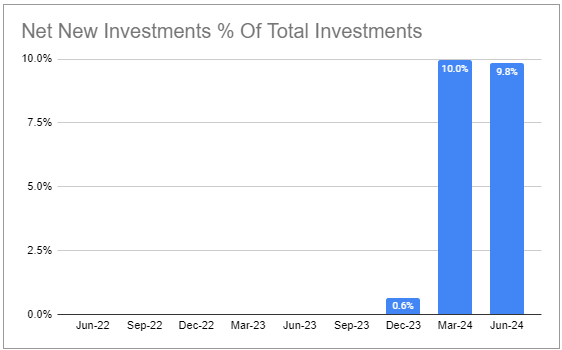
This pushed leverage up to 1.2x – now above the 1.1x median level. This is close to the upper part of the 0.9-1.25x range, so we don’t expect a big increase above the Q2 level.
Systematic Income BDC Tool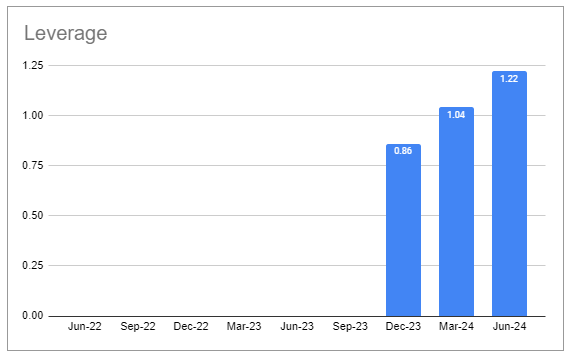
Portfolio Quality
Non-accruals were mixed for the two companies. OBDE non-accruals rose slightly to 0.5% but remain well below the 1.8% sector average. The OBDE number fell to 1.4% as shown below.
Systematic Income BDC Tool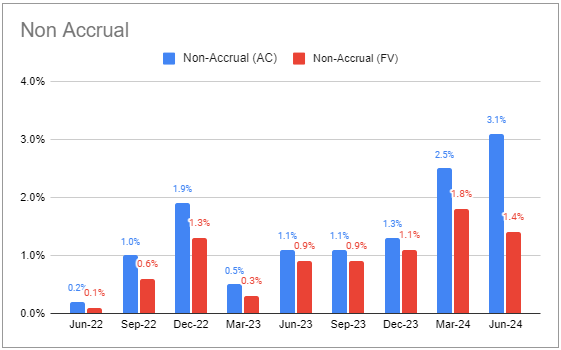
Portfolio quality, as gauged by internal ratings, was stable. The allocation to the two worst buckets remained flat across both BDCs. OBDC figures are shown below.
Systematic Income BDC Tool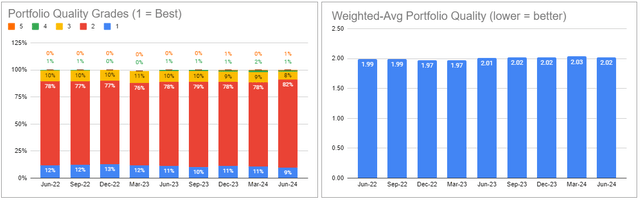
Net realized losses were minimal last quarter for both BDCs. OBDC figures are shown below.
Systematic Income BDC Tool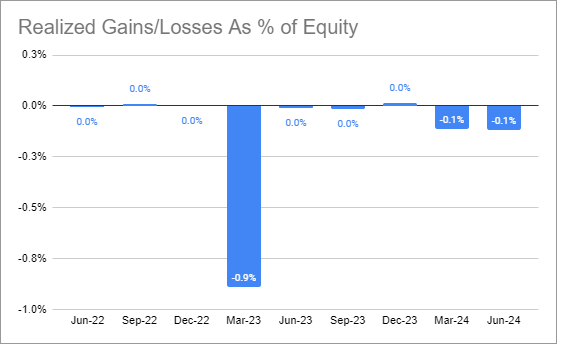
The PIK amounts in both portfolios have been running at around 10% – about the sector average. Management said that around 80% of PIK was structured as such at the time of the investment for performing credits. In other words, it is not a sign of distress in the portfolio.
Systematic Income BDC Tool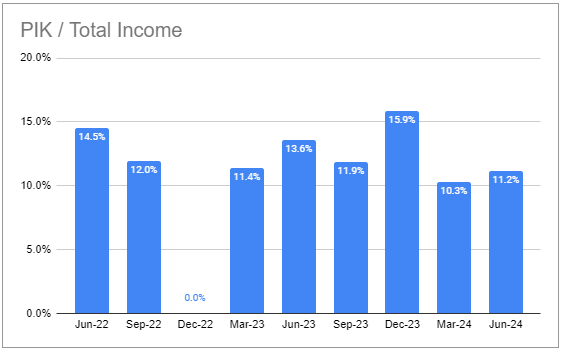
Stance And Takeaways
We continue to have a Buy rating on OBDE. We can summarize this stance with the following three figures.
One, BDCs are much more fairly valued now as a sector after a drop in prices over the past week or so.
Systematic Income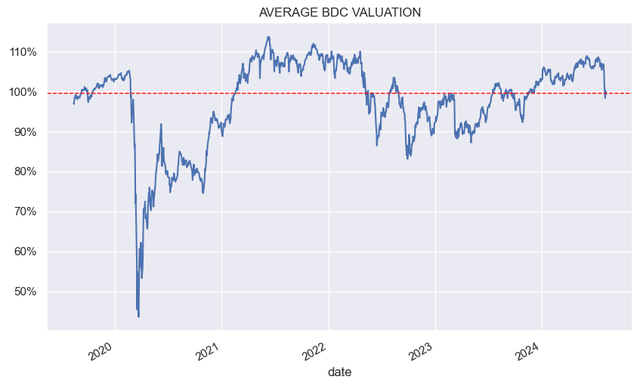
Two, both stocks remain attractive holdings not only because of their solid longer-term total NAV returns but also because they are attractively valued relative to their total NAV returns as shown below.
Systematic Income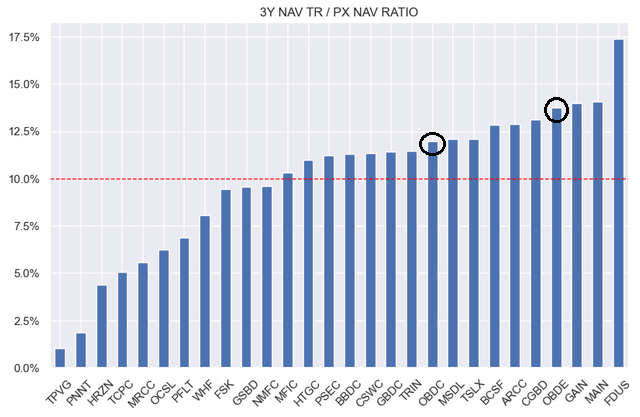
And three, OBDE continues to trade at a discount to OBDC. The valuation gap between the two companies should close, giving an uplift to OBDE shares.
Systematic Income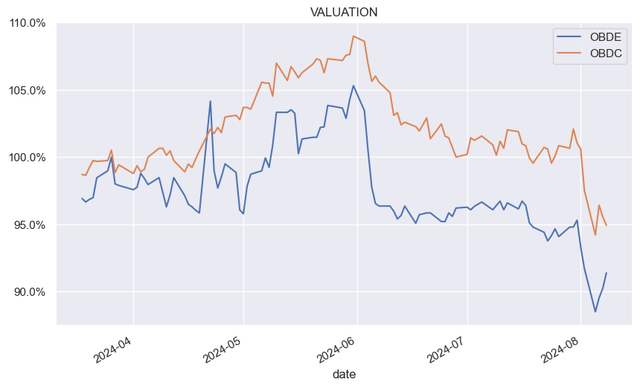
Credit: Source link