

designer491
Overview
VanEck BDC Income ETF (NYSEARCA:BIZD) is a great fund to gain some BDC exposure as well as a sustainable source of high yielding income. The dividend yield of BIZD is over 10% and contains plenty of high quality business development companies within. I believe we are likely to see an increased demand for credit and lending, which can result in an increase in prices within the BDC sector.
The VanEck BDC Income ETF is a fund that aims to replicate and stay on par with the performance of the MVIS US Business Development Companies Index by primarily investing in BDCs. This fund is not actively managed and as a result, has all BDCs within. The ETF has a total expense ratio of 11.17%. However, the management fee of 0.4% is more relevant. The total 11.17% is already taken into account with the distribution so you can be assured that the real dividend yield that you are receiving is still about 10.8%. With factors like the anticipated interest rate cuts after the midpoint of 2024, we will analyze what sort of effect this will have on BDCs. So far though, a lot of BDCs have actively invested in growth opportunities that I believe we can continue to capitalize on. The top holdings of BIZD consists of BDCs that are actively in their portfolio and their distributions.
For reference, the top 5 holdings of BIZD are as follows:
- Ares Capital (ARCC).
- Blue Owl Capital Corporation (OBDC).
- FS KKR Capital Corp (FSK).
- Hercules Capital, Inc. (HTGC).
- Main Street Capital (MAIN).
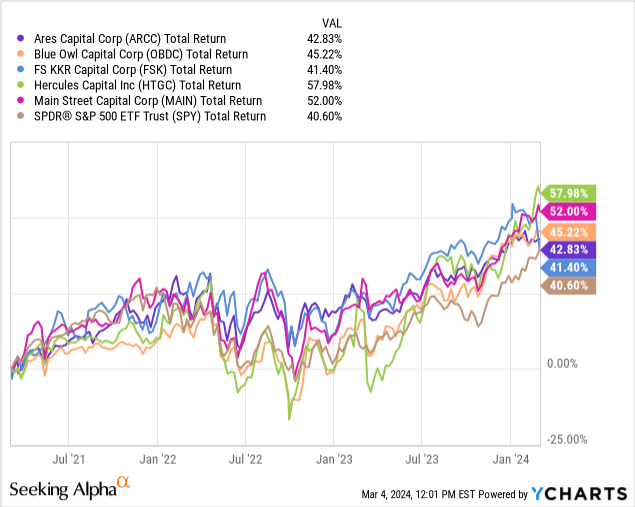
These BDCs have all outperformed the S&P 500 (SPY) over the last 3-year period in total return.
Interest Rates
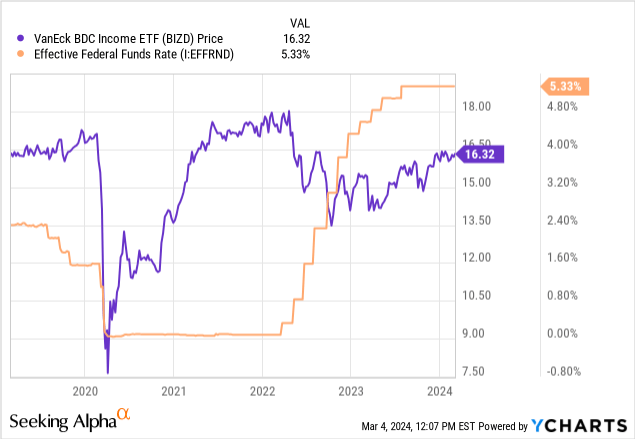
The Fed is anticipated to start cutting interest rates at some point by the middle of 2024. In total, there are expected to be about 3 or 4 rate cuts this year. We can see how when rates started rising in 2022, the price of BIZD started coming down before it stabilized again. Likewise, when rates dropped near zero, the price spiked to about $18/share. However, it’s all up in the air right now since this “higher interest rate” environment is much closer to the normal environment over the last few decades. Gone are the days of near zero rates.
However, assuming we will experience some kind of rate cuts in the near future, I think it’s worth reviewing some insights. Interest rate cuts have historically had a mixed set of results for BDCs. It all comes down to factors such as the fund’s strategies, credit quality, and loan/debt mix. First, let’s discuss the positives like how lower interest rates usually translate to lower financing costs. A lot of BDCs rely on debt financing to fund their portfolio growth or any expansion efforts that may be ongoing. As a result, the lower borrowing costs can create a larger margin of profitability and lower returns can still be offset to equal growth in NII (net investment income).
On the opposite end of the spectrum, interest rate cuts can bring about challenges for BDCs. The most probable issue would be the decreased yields on their investment portfolio. These lower yields would translate into lower cash flow received which may trickle down to you as a shareholder in the form of lower distributions. If not lower distributions, then it would be the absence of supplemental distributions. We’ve seen lots of BDCs issue supplementals over the last two years as they’ve been able to reap the rewards from the higher interest rates. Therefore, interest rate sensitivity is something to take into account over the course of 2024.
Based on the latest insights from Jerome Powell, I do believe rates will come down later on this year. It seems like the Fed are dragging their feet a bit to see how the economic data continues to play out. If they raise rates too soon, it may have a negative effect on inflation and result in more increases in the short term. I also think that the strength in the labor market is also contributing to the delay in rate cuts since unemployment has been low. As a result, I don’t really expect the rate to be cut until the mid-point of the year. We received confirmation of this from Jerome:
“We believe that our policy rate is likely at its peak for this tightening cycle. If the economy evolves broadly as expected, it will likely be appropriate to begin dialing back policy restraint at some point this year. But the economic outlook is uncertain, and ongoing progress toward our 2 percent inflation objective is not assured.“
Top Holding Insights
The top holdings of BIZD have all performed great over the last 3 years and have outperformed the ETF in total return. While the ETF does contain some BDCs that are lesser in quality, the fund still serves as a decent choice for those who want some exposure to the sector. However, I would honestly prefer to hold these top 5 holdings over the entire ETF. This is because the ETF contains some BDCs that have grown at a slower and less consistent rate than these top holdings. As a result, I believe some of these lesser quality BDCs have been a weight on potential price growth. Also, some BDCs within the ETF have a less consistent track record with their dividend. Lastly, we can see outperformance when we look at the performance of the top 5 versus BIZD itself.
- Ares Capital (ARCC).
- Blue Owl Capital Corporation (OBDC).
- FS KKR Capital Corp (FSK).
- Hercules Capital, Inc. (HTGC).
- Main Street Capital (MAIN).
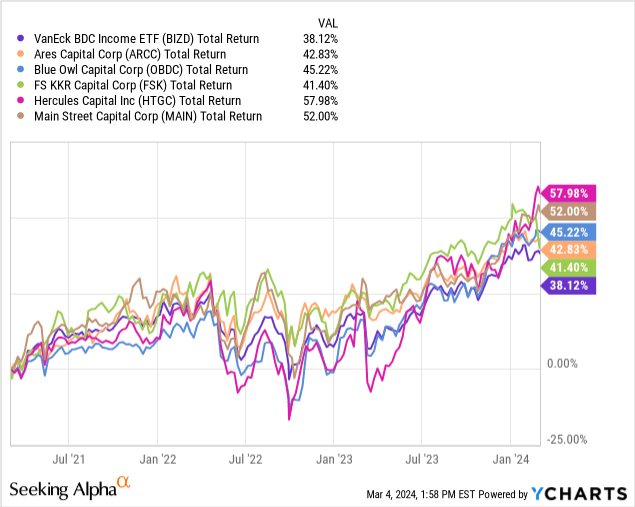
BDCs have experienced a great run since the brief price crash in 2020. Since then, we’ve seen some great news and performances. For example, here are some highlights from the top holdings of BIZD:
- Hercules Capital, Inc. (HTGC): reports record net investment income in Q4 and declared a supplemental dividend.
- FS KKR Capital Corp (FSK): reported a weighted average yield of 11.2% on their debt investments.
- Blue Owl Capital Corporation (OBDC): Raised dividend by 5.7% and announced a supplemental dividend.
- Ares Capital (ARCC): Interest income climbed as expenses dropped.
The commonality between these funds is that they all have a portfolio consisting of floating rate loans. This means they can navigate any interest rate changes over the coming years. As a positive, as rates come down, we are likely to see lowered interest expenses for these BDCs.
I consider BIZD as a buy because BDCs are able to capitalize and navigate future rate changes and remain profitable. If you do not want the exposure of choosing individual BDC funds, this has proven to be a great choice to lock in a huge yield greater than 10%. However, there are some alternatives here. BIZD’s passive indexed approach means that it does have some lesser quality BDCs within. As a result, I’d like to mention a newer fund that is actively managed in comparison.
Lastly, I’d like to circle back to the BDCs within the ETF that have lackluster performance. For example, Prospect Capital Corporation (PSEC) and Goldman Sachs BDC (GSBD) both have not contributed towards any dividend growth. GSBD has issued a few supplementals, but PSEC has not increased their dividend since 2012. In addition, PSEC’s price has declined over 63% since its inception. This leads me to an alternative strategy you can consider if you want to limit your exposure to the lesser quality BDCs.
Alternative Active Strategy
Putnam BDC Income ETF (PBDC) doesn’t seem to have much interest here on Seeking Alpha yet. In fact, the AUM is only $64M so you have the opportunity to enter quite early. The difference here compared to BIZD is that PBDC is actively managed. Being actively managed means that PBDC doesn’t have all BDCs as part of their portfolio and instead have hand-picked a pool of BDCs based on quality.
Putnam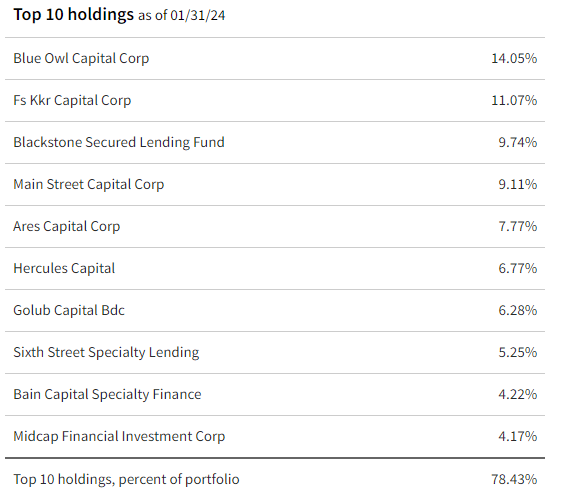
We can see that PBDC shares some of the same top holdings. The top ten holdings make up a large 78.43% of the entire portfolio. More notably however, we are missing some of the underperforming BDCs such as Prospect Capital (PSEC). Putnam management evaluates each BDC’s liability structure, dividend policy, fee structure, and underwriting process before choosing which BDC to include as part of the fund. The difference with this active managed fund is the management fee of 0.75% that we are paying for the hand crafted fund.
PBDC has a dividend yield of 9.6% and pays on a quarterly basis. The fund has performed quite well in terms of price appreciation as well, being up 26% since inception in late 2022 which actually outperforms BIZD. I would like to assume that since there is an active management style here, we may be able to see more of a price appreciation alongside a high level of income. However, we have a limited history here to see how the fund performs in different environments.
PBDC Annual Report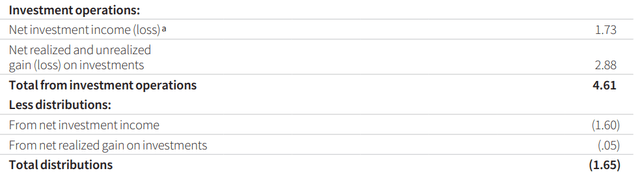
Lastly, the NII out earned the distribution by a healthy margin so there are no worries here about a sustainable dividend. They earned $4.61 in total investment operations, with NII totaling 1.73 by itself. NII alone covered the distribution total of $1.65/share. I mention this alternative fund as an option if you want a more focused BDC ETF that filters out some of the fluff. Either way, I still believe both options here are great if you care more about the income they can provide.
Dividend
Something important to mention is that the high income received from this ETF may have tax consequences when held in a taxable account. This is because BDCs earn income from interest since their portfolios are comprised of debt. Therefore, the dividends received are typically classified as non-qualified.
The current dividend yield is about 10.8% as of the latest declared quarterly dividend of $0.4679/share. For a dividend yield that’s already exceeding 10%, I think the growth of the dividend has made lots of current shareholders happy. For instance, the dividend has grown at a CAGR of 4.4% over the last 10-year period. Even more impressive on a smaller time frame of 3 years, the dividend has increased at a CAGR of 7.24%.
Portfolio Visualizer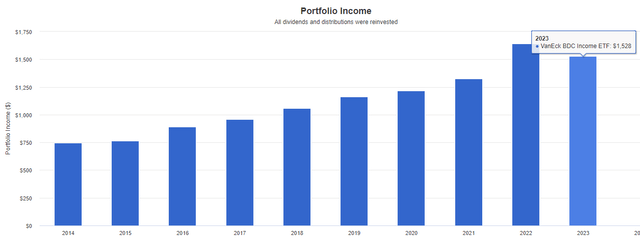
Using Portfolio Visualizer, we can see how an initial investment of $10,000 would have grown over time. These inputs represent no additional capital invested since inception and dividends were reinvested. Starting from 2014, your dividend income from an investment in BIZD would have been about $748 annually. Reinvesting dividends, your dividend income in 2023 would have been $1,528. This would represent a yield on cost of about 15%!
VanEck BIZD Annual Report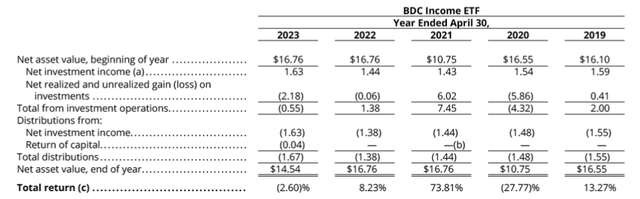
Lastly, the dividend is well covered with net investment income covering the distribution. For BIZD’s fiscal year 2023, the NII total 1.63 in comparison to the prior years NII of 1.44. Note, the distribution for 2023 also included some ROC (return of capital) in 2023 due to a loss on investments because of the market price fluctuations. In short, I believe that BIZD can easily sustain the current distribution level and the ETF serves as a less “risky” way to play the BDC sector.
Valuation
In terms of valuation, I took a look at each of the top 5 holdings to see what the price to NAV (net asset value) relationship looks like. Here’s what I found when referencing the averages over the last 3 year period. Ares Capital traded at an average premium to NAV of 5.8% over the last 3 year period. The price currently sits below this average but the price still trades at a premium to NAV. On the other had, Blue Owl Capital has traded at an average discount to NAV of -8.4%. While the price still trades at a discount to NAV, the discount is much smaller at only 3%. Next, FS KKR Capital has traded at an average discount of 20.9%. The current discount to NAV sits at 23.6% so we have a great buying opportunity at the moment.
Hercules Capital has always traded at a very high premium and averaged a premium of 42%. The current premium to NAV is very high at 58% so now would probably not be the best time to enter. Lastly, Main Street Capital has also averaged a price that trades at a significant premium to NAV. Over the last 3 years, the premium to NAV averaged 59%. At the moment, the current premium is 55%, which falls below the average but still sits extremely high.
Taking these averages into account, BIZD likely trades at the higher end of the range and entry here would not be ideal only if you cared about price upside. The 52-week price range is a low at $13.54/share and high at $16.62/share. So you should be aware that the price sits on the higher end of the price range and the majority of top holdings are currently trading at a premium to NAV. However, I imagine that income is the only focus here so timing the entry holds less importance with a fund like BIZD.
Takeaway
The VanEck BDC Income ETF (BIZD) is a great option for two kinds of investors: The retired investor looking to create a sustainable source of dividend income from their portfolio. BIZD is also a great option for those looking to get some exposure to the BDC sector but would rather take an indexed approach to filter out the risk from picking individual BDCs. The income is well covered and has a slight history of growth.
The fund is not actively managed, unlike the peer PBDC which is actively managed and filters out some of the lesser quality BDCs. The current dividend yield is greater than 10% and is paid out on a quarterly basis. Lastly, If you value capital appreciation or even a high total return, this BDC ETF may not be the best fit for you.
Credit: Source link