

Galeanu Mihai
Welcome to another installment of our BDC Market Weekly Review, where we discuss market activity in the Business Development Company (“BDC”) sector from both the bottom-up – highlighting individual news and events – as well as the top-down – providing an overview of the broader market.
We also try to add some historical context as well as relevant themes that look to be driving the market or that investors ought to be mindful of. This update covers the period through the fourth week of August.
Market Action
BDCs were up nearly 1% on the week as the broader income space continued to rally in light of upcoming Fed rate cuts. Month-to-date, the sector is still down though it has now retraced a big chunk of its early August drop.
Systematic Income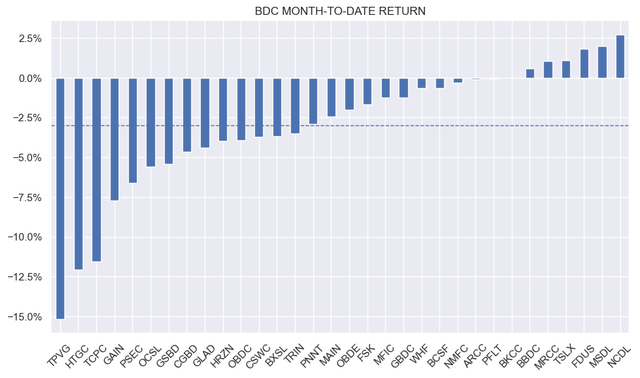
The average valuation in our coverage has swiftly bounced off 100% and risen a few percentage points though it remains off its recent peak.
Systematic Income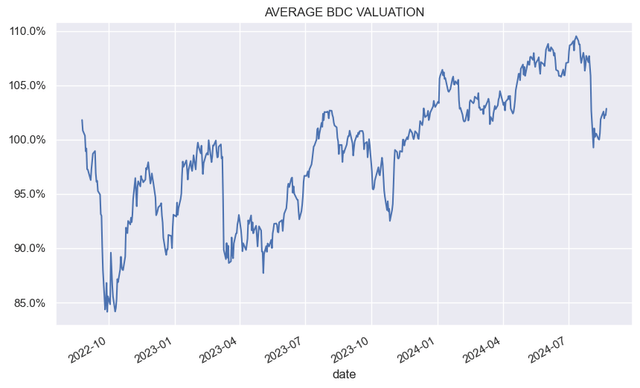
Market Themes
There are three metrics that we focus at the end of each quarter which are net investment income, non-accruals and weighted-average portfolio yield. This gives us a big picture sense of how BDCs are performing along some key dimensions and whether the anecdotal evidence from individual earnings releases jibes well with the aggregate figures.
Systematic Income BDC Tool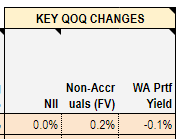
Median net investment income was flat (average was down 0.1%) on the quarter. Stable / slightly lower net investment income makes sense in light of stable short-term rates. Short-term rates are fast-moving first-order drivers of net investment income and they will be kicking in shortly even before the Fed makes its first cut. 3-month term SOFR is now at 5.08% – below 5.31% as of early July as it is already pricing in the September cut.
This means that loan accruals resetting now are doing so at slightly lower levels than earlier in the year. This will start to put pressure on net investment income in Q4. Every Fed rate cut will shave off around 2% of BDC net investment income on average. If the market consensus of 4 rate cuts this year is correct, that will cause an 8% drop in net investment income by Q1 of next year.
Another pressure on net investment income that is also important but slower moving is interest expense – the situation for ARCC is highlighted below. BDCs have been refinancing their lower coupon fixed-rate debt into either higher-coupon fixed rate debt or even higher cost floating-rate debt (whose interest rate will move lower as the Fed cuts rates but is unlikely to match the rate of bonds issued in 2021). This slower-moving net investment income headwind has been working its way into portfolios over the last couple of years and will continue to do so.
A final headwind of net investment income has been the drop in leverage across the majority of BDCs. This is likely aligned with an overall drop in borrower interest coverage and a relatively tight credit spread environment.
Systematic Income BDC Tool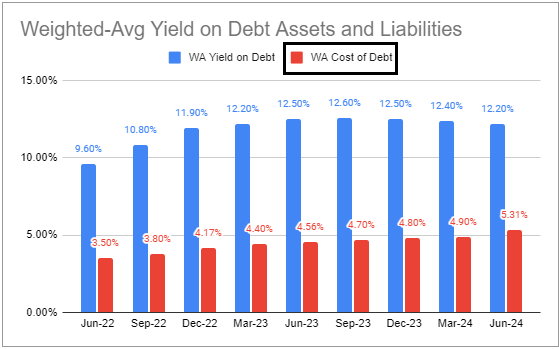
The median non-accrual on fair-value rose by 0.2% (0.4% on average). Non-accruals continue to rise from their earlier trough. This is no surprise and is a simple function of a slowing economy and a low level of interest coverage (typically sub-2x on average though with a significant tail of sub-1x investments in most BDC portfolios). It’s likely that, if the economy holds up and short-term rates come down substantially by mid next-year, non-accruals stabilize and could move lower. That said, there is going to be some noise around non-accruals as companies have some discretion whether to realize losses, restructure loans to equity or continue to work with distressed borrowers to manage outcomes.
Finally, portfolio yields fell slightly over the quarter. This is not a new trend, despite fairly stable short-term rates. Many companies have been moving up the capital structure by overweighting first-lien loans in their allocation – the ARCC composition profile is shown below. This is likely due to caution over a slowing economy as well as a low level of interest coverage. This move is welcome, given BDC NAVs are much more direct drivers of total NAV returns than net investment income.
Systematic Income BDC Tool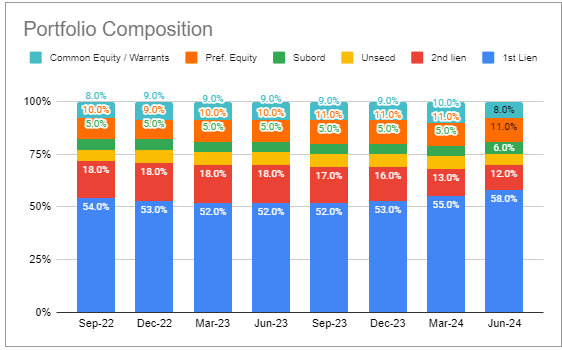
Overall, BDC portfolios have been performing as expected and fairly well in aggregate, though performance divergence has been increasing. This makes sense, as portfolio quality differentiation makes itself apparent only when there is some stress in the economy. Going forward, we expect non-accruals to remain elevated and perhaps rise further and net investment income and portfolio yield to fall.
Market Commentary
BDC Saratoga Investment declared a $0.74 dividend – the first time since mid-2022 that the company did not increase its dividend. This is despite a high level of dividend coverage, around 140%. SAR primarily finances itself almost entirely with fixed-rate baby bonds – a fairly unusual profile in the sector. This might seem odd however this means its net investment income sensitivity to lower short-term rates is very high relative to the broader BDC sector. With around 9 rate cuts priced in, this means the company’s net investment income will fall to right around $0.74 at the point where the Fed is expected to pause – in line with its latest dividend. This gives it just enough margin of safety to allow net investment income to cover the dividend.
Stance And Takeaways
In the first half of August, we took advantage of the drop in BDC prices to add our exposure to the sector at the expense of a number of richly valued CEFs. This has worked out so far, as BDC prices have both risen and outperformed those of CEFs. We continue to see value in a number of BDCs such as the Bain Capital Specialty Finance (BCSF) as well as the Blue Owl Capital Corp III (OBDE).
Credit: Source link