

primeimages/E+ via Getty Images
Market Recap
Equity returns were incredibly strong in the second quarter, and yet this was another difficult period for our portfolios relative to the benchmarks. While the de-escalation of the Iran war helped remove macro and energy overhangs, markets were propelled by a narrow and supercharged AI capex trade. To illustrate, the tech sector returned multiple times more than the overall global and international indexes, and by several measures, market leadership was the most concentrated since 1999.
We benefited through overweights in what we regard as the most moated semiconductor companies in the world, TSMC and ASML, and our differentiated exposure through automation leaders Keyence and Fanuc. However, memory stocks, which also benefited from a surge in retail participation including through leveraged ETFs and derivatives, posted triple digits gains and produced the most outsized return contributions to the overall index. This was detrimental to relative performance because we did not own these stocks in International portfolios and under-owned them in Global portfolios, where we hold a position in Micron.
Separately, our holdings in software and digital, health care, and Greater China lagged a market that rewarded very little outside of the AI capex trade. In fact, many of them continued to de-rate. Therefore, we took the opportunities afforded by the strong market to trim holdings that appreciated the most, led by our semiconductor and automation names, and to redirect the proceeds into a small number of higher conviction positions that lagged. For example, we added to beaten down compounders such as Adyen and Constellation Software, and we continued to build our recently initiated positions in 3i and AIA.
Assessing the year so far, much of the portfolios’ declines have been a compression of valuations, not a deterioration of earnings. For many of our holdings, the two have moved in opposite directions. Revenues, profitability, and cash flow have continued to build, even as the multiples placed against them have fallen. That divergence between rising intrinsic value and falling stock price is precisely what coils a spring. As that gap closes, the compression that worked against us becomes the raw material for future returns. We believe we hold a portfolio of healthy, growing businesses whose earnings power has advanced while their prices have reset, and that is the foundation of our conviction over our five-year investment horizon.
In the second quarter of 2026, the Baird Chautauqua International Growth Fund Net Investor Class returned +10.39%, underperforming the MSCI ACWI ex-U.S. Index® ND, which returned +14.49%. The Baird Chautauqua Global Growth Fund Net Investor Class returned +12.18% during the quarter, underperforming the MSCI ACWI Index® ND, which returned +14.93%.*
Market Update
For the MSCI ACWI ex-U.S. Index and in emerging markets, growth style outperformed value style. Within the MSCI ACWI Index, growth also outperformed value, and large capitalization stocks performed in line with small capitalization stocks.
Both sector performance and country performance leaned positive for the quarter.
MSCI Sector and Country Performance (QTD as of 6/30/2026)
Source: FactSet. Based on MSCI country returns.
*Returns less than one year are not annualized. The performance data quoted represents past performance. Past performance does not guarantee future results. Investment returns and principal value will fluctuate and shares, when redeemed, may be worth more or less than their original cost. Current performance data may be lower or higher than the data quoted. Returns include reinvestment of dividends and capital gains. To obtain the most recent month-end performance data available, please visit Baird Asset Management.
The dispersion beneath those growth and value style labels was one of the quarter’s defining features. The distance between the handful of winners and the rest of the market widened to a rare degree, and the rally was as much a momentum event as a growth one, with the stocks that had already led extending their performance advantage nearly week after week. For a concentrated long-term manager, the quarter was less a question of style and more a question of whether one owned the specific narrow cohort the market chose to reward.
Q2 2026 Returns Comparisons within International and Global
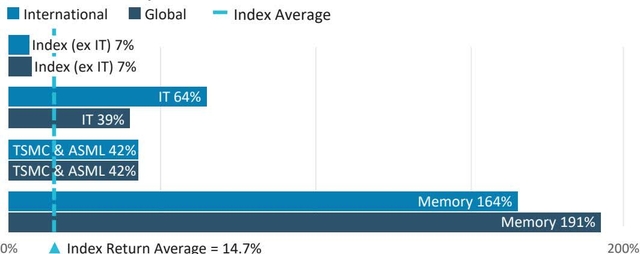
Source: Bloomberg, FactSet. International represented by MSCI ACWI ex-U.S. Index. Global represented by MSCI ACWI Index. Memory is the weighted average return of Samsung, SK Hynix, and Kioxia. TSMC & ASML is the weighted average return of the two. Index (ex IT) is the weighted average return of all sectors in each Index, excluding IT. Index total return average is the average return for the period of the MSCI ACWI ex-U.S. Index and MSCI ACWI Index. Past performance is not indicative of future performance.
Two forces defined the period, moving in opposite directions. The unwinding of the energy shock removed the prior quarter’s macro overhang, as the geopolitical risk premium rapidly deflated. Simultaneously, the continued concentration of capital into the AI infrastructure complex determined the winners as the market’s risk appetite returned. The collision of the two produced a sector reversal. Energy gave back its gains to trail the market, while the AI infrastructure trade compounded its momentum to historic extremes. That leadership was also narrow. In international markets, IT’s outperformance left the rest of the index entirely behind. Only industrials and financials produced double-digit returns, and both still lagged the broader market.
Compounding the picture for international investors, the U.S. dollar firmed against a consensus narrative that had expected it to weaken, reaching a multi-month high as the yen sank to a multi-decade low. That move was a modest headwind to dollar-denominated international returns, serving as a reminder that the widely held weak dollar thesis has not paid off.
This is the backdrop against which our relative results must be read, and it is worth stating plainly that markets this narrow have historically been a poor guide to the next several years of returns rather than a durable state of affairs.
The quarter also brought the first synchronized hawkish impulse across the developed world in several years, set off by the energy-fueled inflation spike in the spring. Within a single week, three major central banks moved in the same direction. The Federal Reserve (Fed), meeting for the first time under its new Chairman, Kevin Warsh, held its policy rate steady but flipped its dot plot projections to signal a coming rate increase. Nearly every participant now judges the risks to inflation to lie to the upside, which is a marked reversal from the easing bias with which the year began. The European Central Bank (ECB) went further, delivering its first rate increase since 2023 and reversing eight consecutive cuts, a stagflationary posture as it tightened into visible economic weakness. The Bank of Japan (BOJ) raised its policy rate to a three-decade high, propelled by a weak yen and the year’s strong spring wage negotiations, known as shunto. Because this inflation impulse was overwhelmingly an energy phenomenon, and with oil having retraced its wartime gains, consumer inflation most likely peaked in May, even if the Fed’s preferred inflation gauge had not yet captured the June relief as the quarter closed.
In the U.S., the labor market presented two realities at once. On the demand side, it remained firm, with job openings holding near a two-year high and layoffs among the lowest on record, a resilience that surprised forecasters who had expected the Iran conflict to dent hiring. Beneath that firmness, however, workers have lost confidence. Quit rates sit near multi-year lows, hiring is subdued, and the share of consumers who describe jobs as hard to get has climbed to a five-year high. Two threads within this split matter for us. The first is an unmistakable AI fingerprint in white collar and technology hiring, where openings in knowledge work-related roles have fallen the furthest of any category, even as postings that require AI skills climb. The second is that consumer sentiment, though still near its lows, has begun to stabilize as energy relief lifts expectations. Above all of this sits the AI capex boom itself, which has become the single most important engine of U.S. growth, offsetting a consumer who is spending more cautiously as real incomes are squeezed.
Trade policy remains a live source of uncertainty. Following the Supreme Court’s decision earlier in the year striking down the prior tariff regime, which cut the average effective U.S. tariff rate from roughly 16% to 9%, the administration fell back on a temporary 10% across-the-board tariff that is set to expire in late July unless Congress acts. More durable, sector-specific tariffs on steel, aluminum, and copper, with semiconductors and pharmaceuticals under review, are becoming the replacement. Investors should expect the tariff question to stay unresolved and episodic rather than to settle, and the late July cliff is a near-term catalyst worth watching.
Europe continued to exhibit a mild stagflation, with economic activity contracting gently even as inflation ran above target. The internal split mirrored the U.S. in reverse. Manufacturing proved resilient, buoyed by inventory building and front-running, while services bore the brunt of the hit to household purchasing power. The energy shock lifted eurozone inflation to multi-year highs, which is precisely what drew the ECB into tightening at an inopportune moment. Much of the survey data was collected before the mid-June de-escalation, suggesting the readings understate the relief now underway. The most important structural offset remains Germany’s fiscal expansion, the roughly one trillion euro commitment to infrastructure and defense that is beginning to show up in the data and that represents a genuine, multi-year change in the region’s growth posture.
China remained a two-speed economy. On one side is a strong policy-supported supply side of exports, advanced manufacturing, and IT hardware. On the other is a demonstrably weak demand side, with retail sales turning outright negative in May for the first time in years. Stimulus has been incremental, and its transmission into the real economy is modest because banks are passing very little of the central bank’s easing through to borrowers. Meanwhile, the U.S.-China relationship has stabilized at a higher-tariff baseline, though with truces on tariffs and rare earth export controls both set to expire in November, which leaves some fragility beneath the current calm. For our holdings in Greater China, the relevant point is that this quarter’s weakness in stock performance owed more to capital chasing the AI trade elsewhere in the region than to any fresh deterioration in the underlying businesses.
FUND PERFORMANCE AS OF JUNE 30, 2026
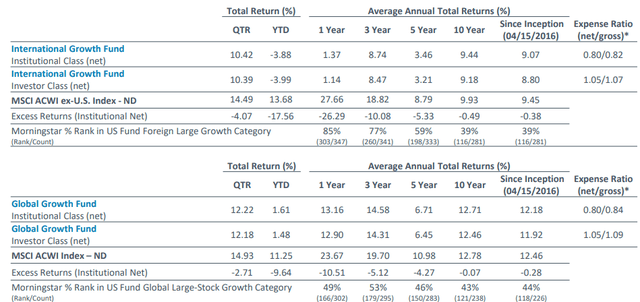
Returns less than one year are not annualized. The performance data quoted represents past performance. Past performance does not guarantee future results. Investment returns and principal value will fluctuate and shares, when redeemed, may be worth more or less than their original cost. Current performance data may be lower or higher than the data quoted. Returns include reinvestment of dividends and capital gains. To obtain the most recent month-end performance data available, please visit bairdfunds.com.
The Morningstar percentile rankings are for the Institutional Share Class of the Funds and are based on the average annual total returns for the periods stated and do not include any sales charges but do include reinvestment of dividends and capital gains and Rule 12b-1 fees. The highest (or most favorable) percentile rank is 1 and the lowest (or least favorable) percentile rank is 100.
*The Net Expense Ratio is the Gross Expense Ratio minus any reimbursement from the Advisor. The Advisor has contractually agreed to waive its fees and/or reimburse expenses at least through April 30, 2027, to the extent necessary to ensure that the total operating expenses do not exceed 1.05% of the Investor Class’s average daily net assets and 0.80% of the Institutional Class’s average daily net assets. Investor class expense ratios include a 0.25% 12b-1 fee.
Performance Attribution
The Baird Chautauqua International Growth Fund underperformed its benchmark during the quarter, as stock selection in information technology, consumer discretionary, and financials, and a relative overweight in health care, detracted the most from relative returns. Stock selection in industrials and lack of exposure to energy and materials contributed the most to relative returns during the period. From a regional perspective, stock selection in North America and Asia & the Pacific Basin detracted from relative performance, while relative underweight and holdings in Europe contributed. The largest relative detractors were Alibaba, Lululemon, and Brookfield Renewable, while the largest relative contributors were Recruit, ASML, and Keyence.
The Baird Chautauqua Global Growth Fund underperformed its benchmark during the quarter, as stock selection in consumer discretionary and financials, and both a relative overweight and holdings in health care, detracted the most from relative returns. Stock selection in industrials and communication services and lack of exposure to energy contributed the most to relative returns. From a regional perspective, stock selection in North America and Asia & the Pacific Basin detracted from relative performance, while holdings in Europe contributed. The largest relative detractors were Regeneron, TJX, and Lululemon, while the largest relative contributors were Micron, ASML, and Recruit.
Baird Chautauqua International Growth Fund Top & Bottom Contributors for Q2 2026
Top 5 Contributors
Bottom 5 Contributors
Baird Chautauqua Global Growth Fund Top & Bottom Contributors for Q2 2026
Top 5 Contributors
Bottom 5 Contributors
Source: FactSet. The holdings identified do not represent all the securities held, purchased or sold for the Funds during the period; past performance does not guarantee future results. Holdings are subject to risk and can change at any time. To obtain information about the calculation methodology and a list showing all holdings and their contribution, please contact Baird.
Largest Contributors
Recruit Holdings Co., Ltd.
Recruit reported March quarter results that beat consensus expectations, with its HR Technology segment substantially exceeding the outlook management previously set. More specifically within HR Technology, U.S. revenue grew 26% y/y, with the price/mix effect from AI-driven Premium Sponsored Jobs more than offsetting soft volumes. Management guided monetization to continue higher and HR Technology margins to expand toward 41%, with growth accelerating past 20% if volumes recover.
ASML Holding NV
ASML reported solid 1Q26 results and raised its guidance for 2026. Management noted that orders remained strong and that demand continues to strengthen, driven by AI infrastructure investment, robust chip demand, and customers accelerating capacity-expansion plans for 2026 and beyond.
Keyence Corporation (International)
Keyence reported March quarter results that beat consensus estimates, with revenue growing 18% y/y, its strongest growth in four years. Overseas markets were particularly strong, and strong demand from the semis and electronics end markets were specifically called out. Operating margin expanded to nearly 54%. Management also revised the company charter to facilitate share buybacks for the first time, signaling a more shareholder-friendly capital allocation stance.
Largest Detractors
lululemon athletica inc.
Lululemon reported an in-line 1Q26 but lowered its 2Q26 and FY26 guidance, reflecting slowing North American demand despite continued international growth. The stock declined as investors reset near-term expectations amid uncertainty around the brand reset. We continue to own it given the resilient core franchise, material differentiation, strong cash generation, aggressive buybacks, and a refreshed board and CEO—factors that, combined with a depressed valuation, keep the risk-reward attractive.
Alibaba Group Holding Limited (International)
Alibaba reported an in-line quarter, and the stock reacted positively after the report. However, from mid-May through quarter-end, the stock declined as investors became more cautious on its AI model performance, AI capex spending, and lackluster consumer spending in China.
Brookfield Renewable Holdings (International)
Brookfield Renewable (BEPC) reported 15% y/y FFO/share growth in 1Q26, well above consensus and above its 10% growth target. New project delivery and higher capital recycling underpin this acceleration, with BEPC doubling the pace of projects commissioned from its 85 GW pipeline. Despite strong fundamentals, shares lagged in the quarter due to temporary technical trading factors tied to Brookfield’s proposed consolidation of BEP and BEPC share classes.
Largest Contributors (continued)
Micron Technology, Inc. (Global)
Micron reported very strong FY3Q26 results and issued above-consensus guidance, as AI-driven demand and supply tightness continued to drive pricing, which was again the primary driver of growth for both DRAM and NAND. Micron announced 16 strategic customer agreements covering 20% of its DRAM volume and 1/3 of its NAND volume. We reduced our weight because the business remains cyclical and very high pricing does not last as new competitors emerge and industry participants increase capacity.
Largest Detractors (continued)
Regeneron Pharmaceuticals, Inc. (Global)
Regeneron reported a quarter with good financial results, supported by strong Dupixent performance, but slower-than-expected conversion from Eylea to Eylea HD was a concern for some investors. The failure of its phase III LAG3 melanoma trial was a blow to investor confidence. Regeneron’s current cash balance and free cash flow generation provide a valuation floor as we await progress across the rest of its pipeline.
TJX Companies Inc. (Global)
For its fiscal 1Q ending in April, TJX delivered another high-quality beat on sales, margins, and EPS. Consolidated same-store sales rose 6% y/y, well above guidance, and operating leverage drove higher-than-expected margins and profit. On its strong start to the July quarter, TJX raised its full-year outlook and lifted its annual buyback target 10% to ~$3 billion. We believe the market has yet to fully recognize TJX’s solid fundamentals.
Portfolio Highlights | Buys and Sells
For the Chautauqua International Growth Fund, 90% of companies that reported earnings during the quarter were in-line with or exceeded consensus estimates.
For the Chautauqua Global Growth Fund, 90% of companies that reported earnings during the quarter were in-line with or exceeded consensus estimates.
Our conviction weighting process, which considers our estimates for growth, profitability, and valuation, is key to our portfolio management strategy and has been additive to returns over the long run.
In the International Fund, we exited Bank Rakyat and reduced positions in Brookfield Renewable, Canadian Pacific Kansas City, DBS, Fanuc, Genmab, Keyence, Recruit, Ryanair, Safran, Suzuki, and TSMC. Proceeds were used to increase positions in 3i, Adyen, AIA, and Constellation Software.
In the Global Fund, we exited Bank Rakyat and reduced positions in Brookfield Renewable, DBS, Fanuc, Keyence, Micron, Safran, and Suzuki. Proceeds were used to increase positions in 3i, Adyen, AIA, Constellation Software, and Ryanair.
Outlook
While the Middle East overhang has receded, what remains is extreme concentration in the equity markets, compounded by unresolved trade policy, a newly hawkish Fed, and an AI capex trade whose durability is openly debated.
In the U.S., the Fed faces a genuinely two-sided risk. Its June projections turned hawkish, and future hikes remain possible should energy-driven inflation prove sticky. Yet, a quietly softening labor market argues for patience. The clearer near-term catalyst is tariff pass-through. The temporary measures that followed the Supreme Court’s ruling expire in late July, presenting a policy cliff that would act as a regressive tax on a consumer whose room to absorb it is already thin.
Europe is more constructive but fragile. Germany’s fiscal pivot, which is the largest expansion in its post-war history, should lift eurozone growth through the end of the decade, and manufacturing has returned to expansion as defense spending rises. At the same time, a second energy crisis in four years again exposed the region’s vulnerability and drew the ECB into tightening directly into economic weakness. The balance between this fiscal tailwind and energy headwind could steer European performance from here.
China faces a pivotal year. Policymakers have cut their growth target to a record low and elevated domestic consumption to their highest priority, an overdue admission that exports and investment cannot substitute for household demand. The property downturn still weighs on confidence, retail sales turned negative in May, and stimulus has been targeted rather than transformative. The execution of that consumption pivot is one of the key uncertainties.
Our strategy favors companies with durable competitive advantages, healthy margins, strong balance sheets, and consistent cash generation. That commitment is unchanged, but the past two quarters were a humbling reminder of how drastically valuation multiples can compress when a narrative shifts. The year-to-date drawdown in many of our holdings was a function of that compression, not earnings deterioration. Concentrated quality portfolios that endure this kind of sentiment-driven dislocation have historically been well-positioned to recover as valuations normalize, and we have used this volatility to concentrate capital where our conviction is highest.
While AI is a profound secular trend, we respect the skepticism regarding how long hyperscalers can sustain record capex spending and whether AI monetization will keep pace with the hundreds of billions of dollars of data centers either already deployed or under construction. By owning the indispensable semiconductor picks and shovels, TSMC and ASML, alongside automation leaders Keyence and Fanuc, we seek to participate in the economics of the buildout today without having to predict which downstream model platform ultimately wins. And because we also own the de-rated growth franchises that benefit as market leadership broadens, our positioning does not rest on a single binary outcome.
3i Group had a 1.86%, Adyen 2.51%, AIA Group 1.41%, Bank Rakyat 0.00%, Canadian Pacific Kansas City 3.69%, Constellation Software 3.31%, DBS 4.61%, Galderma 2.66%, Genmab 3.91%, KE Holdings 3.31%, Kioxia 0.00%, Ryanair 2.80%, Safran 4.12%, Samsung 0.00%, Sea Limited 3.09%, SK Hynix 0.00%, Suzuki 2.09%, Temenos 2.46%, Tencent 0.00%, and WuXi Biologics 3.10%, weighting in the International Fund as of 6/30/2026. 3i Group had a 1.41%, Adyen 1.85%, AIA Group 1.04%, Bank Rakyat 0.00%, BeOne Medicines 2.91%, Constellation Software 2.57%, DBS 3.25%, Fanuc 2.51%, Galderma 2.10%, KE Holdings 2.09%, Kioxia 0.00%, Ryanair 2.08%, Safran 3.33%, Samsung 0.00%, Sea Limited 2.08%, SK Hynix 0.00%, Suzuki 1.52%, Temenos 1.16%, Tencent 0.00%, and WuXi Biologics 2.06% weighting in the Global Fund as of 6/30/2026.
Given how severely the market has repriced our holdings, it is reasonable to ask why we maintain meaningful commitments to the areas that have recently hurt us: software and digital platforms, health care, and Greater China. Across these various sleeves, the common thread has been valuation compression against businesses whose cash flows and competitive positions have continued to build.
The market has de-rated many of our holdings in software and digital businesses, treating them as structural casualties of the AI disruption narrative. We view this terminal value assessment as materially disconnected from operational reality. The competitive moats of Constellation Software, Adyen, and Sea are built on deep customer integration, regulatory complexity, and network scale. We believe these businesses are too critical to clients’ daily operations and revenue generation to rip and replace. Both software and platform holdings continued to execute robustly through the stock price drawdown. In the case of Temenos, there has been an overhang over its Gulf customer base stemming from the Iran conflict, rather than a structural flaw in its software business.
Our Greater China* holdings (roughly 18% of International and 12% of Global) are deliberate overweights and individually underwritten. They are concentrated in secular growth areas of the domestic economy that align with government priorities. Furthermore, the quarter’s returns weakness also owed more to capital chasing the AI trade, especially in other emerging markets, than to fundamental deterioration. Alibaba and Tencent may not lead in open-source AI models, but value can accrue to the cloud, distribution, and commerce layers they already dominate. Furthermore, companies such as KE, which is an entrenched real estate platform in a stabilizing housing market, and AIA, which is the leading pan-Asia life insurer, demonstrate business models driven by domestic demand.
In health care, the strongest fundamental stories were among the hardest hit as the sector fell out of favor. BeOne Medicines and WuXi Biologics both continued to execute well, yet fell together in a sharp decline that swept the entire Chinese biopharma complex, a sympathy move rather than company-specific events. Genmab remains valuable for its pipeline, but the market has been fixated on a future royalty step-down for Darzalex. Meanwhile, Galderma has continued to compound its dermatology franchise.
U.S. valuations remain significantly elevated, with the cyclically adjusted price-to-earnings ratio near historical peaks, while international markets trade at considerably lower valuations. We do not lean on that discount as a thesis in itself, having watched it persist for years without reward, but paired with intact earnings, we think it tilts the odds in our favor. The forward setup is a matter of probability rather than prophecy.
The underlying earnings power of our portfolio remains fully intact, and in many cases, it has advanced, while prices have fallen. That divergence between rising intrinsic value and falling stock price is precisely what coils a spring. Valuation remains the raw material of future returns, and we believe the multiple compression of the past two quarters has created an unusually attractive entry point for patient capital over our five-year investment horizon.
Business Update
There have been no changes to the investment team at Chautauqua Capital Management, nor have there been any changes to the ownership structure of our parent company, Baird.
Respectfully submitted,
The Partners of Chautauqua Capital Management – a Division of Baird
*Includes China, Hong Kong, and Prosus.
Original Post
Editor’s Note: The summary bullets for this article were chosen by Seeking Alpha editors.
Credit: Source link