

champpixs
Increasingly, factor investing is gaining in popularity, as investors look for superior ways to pick stocks that are different from passive measures like market capitalization that end up overweighting popular stocks like the ‘Magnificent 7’. Instead, factor investing screen securities based on specific drivers of returns like value, momentum, quality, and low volatility.
The Global X Adaptive U.S. Factor ETF (NYSEARCA:AUSF) is Global X’s attempt to create a multi-factor portfolio with a dynamic ‘twist’. The AUSF uses the trailing relative performance to allocate between the three factors: value, momentum, and low volatility.
Although AUSF has historically performed well with an impressive flat year in 2022 when the equity markets suffered a steep decline, I personally worry about AUSF’s lagged strategy, particularly around market inflection points.
Instead, I prefer the business cycle investing approach of the Invesco Russell 1000 Dynamic Multifactor ETF (OMFL). OMFL has historically outperformed AUSF with higher absolute and risk-adjusted returns.
Fund Overview
The Global X Adaptive U.S. Factor ETF seeks to deliver superior returns compared to traditional market cap-weighted indexes by allocating across three factors – minimum volatility, value, and momentum – that have historically demonstrated advantages compared to the indexes.
The AUSF ETF is rebalanced quarterly. At each rebalance date, the ETF will allocate weights to the three underlying single-factor sub-indices based on the relative performance of each sub-index since the last rebalance. The AUSF ETF will either allocate to two factors with a 50/50 weighting or all three factors with 40/40/20 weighting (Figure 1). However, it is unclear how the fund will choose between 50/50 and 40/40/20 allocations.
Figure 1 – AUSF overview (globalxetfs.com)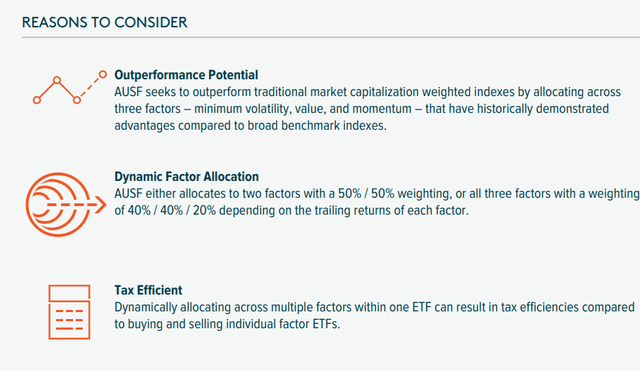
The AUSF ETF has $200 million in assets and charges a 0.27% total expense ratio (Figure 2).
Figure 2 – AUSF is a small fund with only $200 million in assets (globalxetfs.com)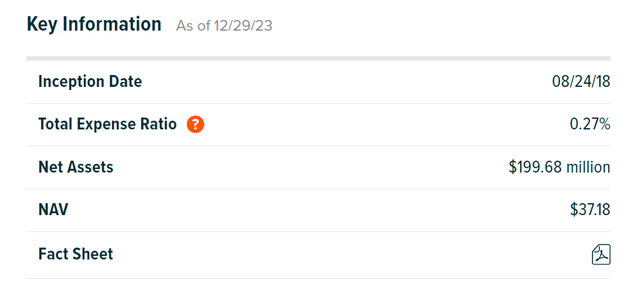
Portfolio Holdings
Although the AUSF ETF claims to invest in at least two of the three factors at any given time, the fund’s website or marketing documents do not give investors any indication which factors are being emphasized, nor their weights.
What we do know is that the overall portfolio currently has sector allocations shown in Figure 3. The AUSF ETF’s largest sector weights are Financials (25.6%), Information Technology (21.4%), Industrials (13.4%), Consumer Discretionary (10.9%), and Communication Services (8.7%).
Figure 3 – AUSF current sector allocation (globalxetfs.com)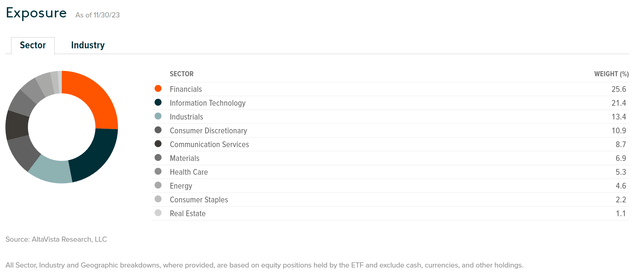
According to Morningstar’s portfolio analysis, AUSF’s portfolio as of November 30, 2023 has a ‘Value’ and ‘Momentum’ tilt, while ‘Low Volatility’ does not appear to be emphasized (Figure 4). So my best guess is the fund currently has either a 50/50 Value/Momentum allocation or a 40/40/20 Value/Momentum/Minimum Volatility allocation.
Figure 4 – AUSF factor decomposition (morningstar.com)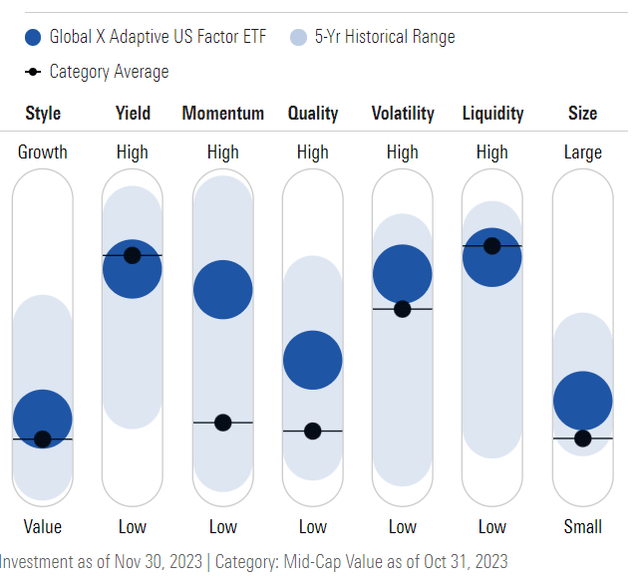
Factor Returns Ebb And Flow
Why does it matter what factors are being emphasized within AUSF’s portfolio? The reason factor allocations matter is because according to S&P Global’s research, the active returns (i.e. ‘alpha’) of individual factors ebb and flow through time (Figure 5).
Figure 5 – Factor active returns ebb and flow (S&P Global)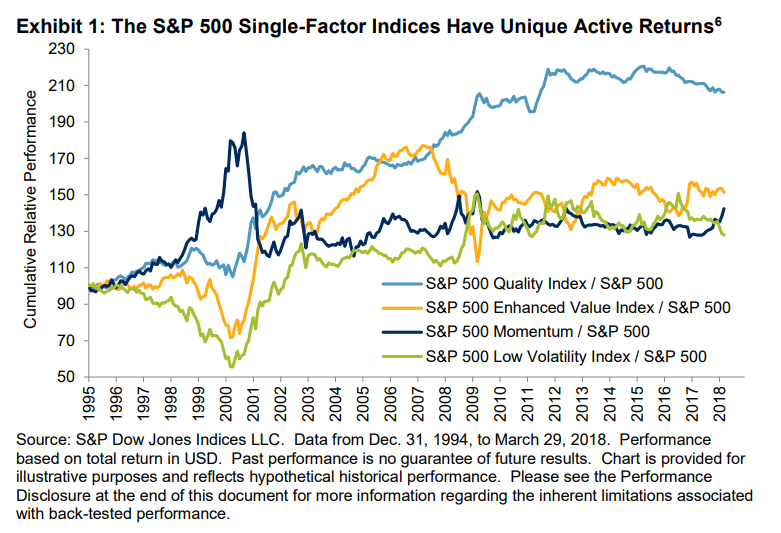
Also, from economic analysis, we know that different investments will outperform/underperform depending on the phase of the business cycle. If we do not know what is the AUSF ETF’s current factor allocation, it is hard to judge whether the fund is properly positioned going forward.
Furthermore, since AUSF’s allocation is based on trailing performance of the three factors, there is a certain amount of built-in lag in AUSF’s allocation decision, especially around market inflection points. The AUSF ETF may still be emphasizing Value and Momentum because those have performed well in the prior quarter, while economic conditions may warrant caution with the Low-Volatility factor.
Distribution & Yield
Investors considering the AUSF ETF should not expect a large distribution yield, as the AUSF ETF only paid a 2.0% distribution yield in the trailing 12 months (Figure 6).
Figure 6 – AUSF only yields 2% (Seeking Alpha)
Returns
Historically, the AUSF ETF has performed well, with 1/3/5 year average annual returns of 22.2%, 15.8%, and 14.3% respectively to December 31, 2023 (Figure 7).
Figure 7 – AUSF historical returns (morningstar.com)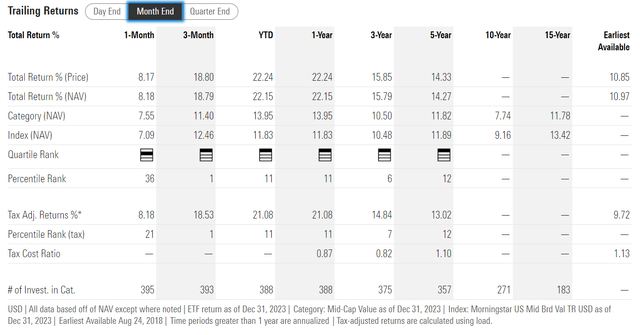
Impressively, AUSF barely declined in 2022, with a -0.1% return compared to an 18.1% decline for the S&P 500 Index (Figure 8).
Figure 8 – AUSF was impressively flat in 2022 (morningstar.com)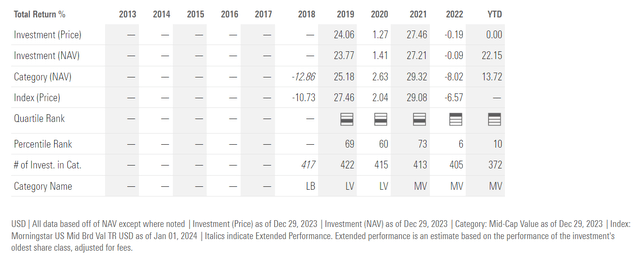
How did the AUSF ETF perform so well in 2022? Reading the fund’s 2022 commentary (November 2022 fiscal year-end), we learned that the AUSF was able to avoid the worst of the 2022 drawdowns from “factor investing and volatility reduction strategies” (Figure 9).
Figure 9 – Excerpt from AUSF’s 2022 annual report (globalxetfs.com)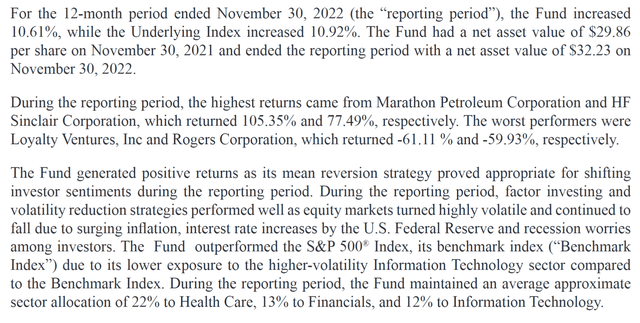
My understanding of the commentary is that the AUSF ETF went to 50/50 allocation between the Value/Low Volatility factors and avoided the worst hit stocks in the Information Technology Sector.
AUSF Vs. OMFL
Another question I have is how does the AUSF ETF compare to my current favourite factor investing fund, the Invesco Russell 1000 Dynamic Multifactor ETF (OMFL)?
OMFL takes a business cycle investing approach to factor investing, emphasizing different factors depending on Invesco’s assessment of the current phase of the business cycle (Figure 10). When the economy is in Recovery phase, OMFL will emphasize aggressive factors like Size and Value, while Contraction phase warrants defensive factors like Quality and Low Volatility.
Figure 10 – OMFL overview (invesco.com)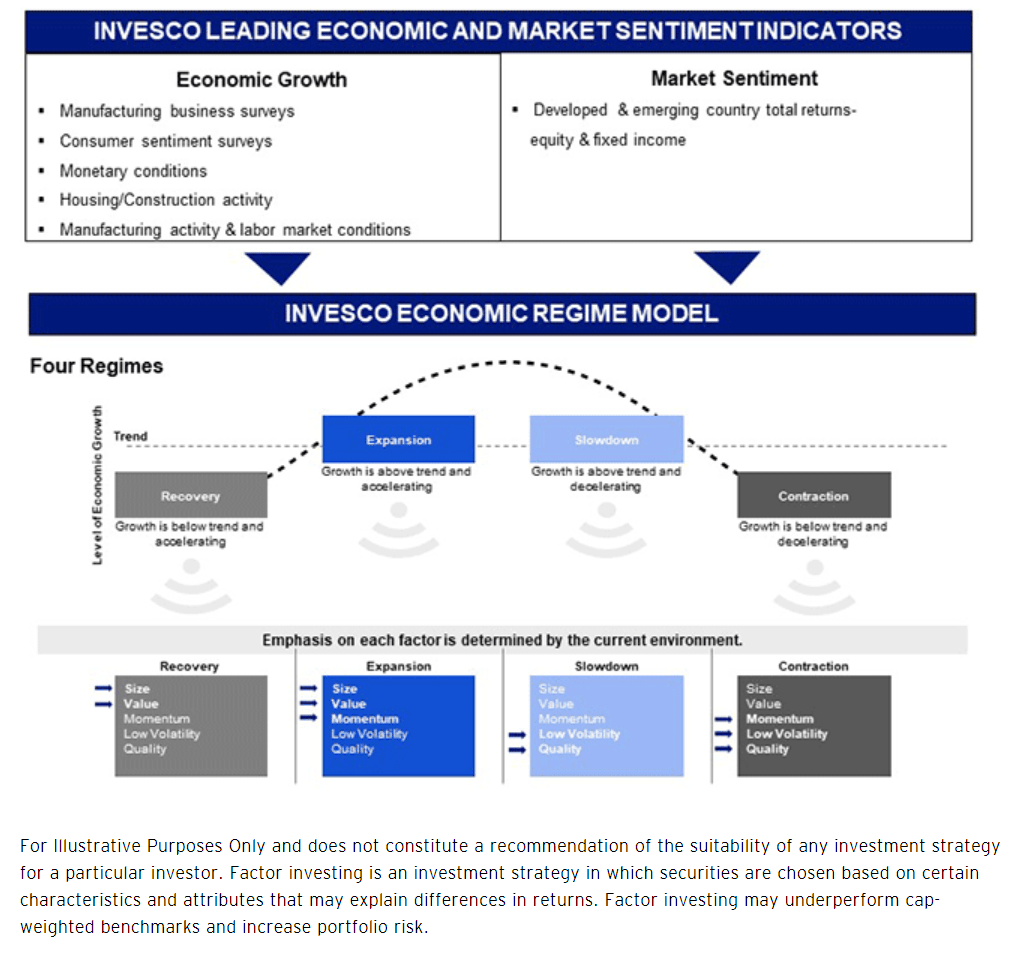
First, on fund structure, the AUSF ETF is slightly cheaper than OMFL, charging a 0.27% expense ratio compared to OMFL’s 0.29% (Figure 11). Both funds are more expensive than the passive SPDR S&P 500 ETF Trust (SPY).
Figure 11 – AUSF vs. OMFL, fund structure (Seeking Alpha)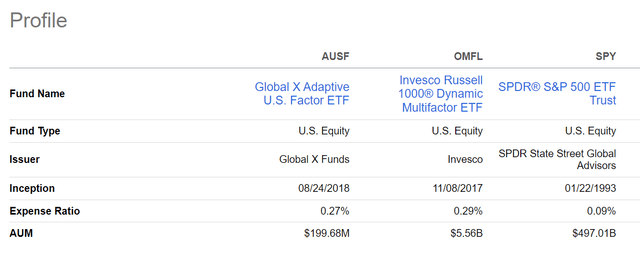
AUSF has not been very successful in gathering assets, with only $200 million in AUM compared to OMFL’s $5.6 billion and SPY’s $497 billion.
Comparing their strategies, both AUSF and OMFL dynamically adjust their factor allocations. AUSF’s allocation is based on trailing relative performance of the three selected factors whereas OMFL is based on Invesco’s assessment of the economic environment.
Intuitively, I like OMFL’s strategy more as it aligns with my personal view of using macro analysis to outperform market indices. However, OMFL does introduce human judgment error whereas AUSF’s strategy is based on factual relative performance data.
With respect to historical performance, OMFL has delivered stronger historical performance with a 13.5% returns CAGR compared to 10.9% for AUSF and 11.6% for SPY, measured from September 2018 (AUSF was incepted in August 2018) to December 2023 (Figure 12).
Figure 12 – AUSF vs. OMFL, historical performance (Author created with Portfolio Visualizer)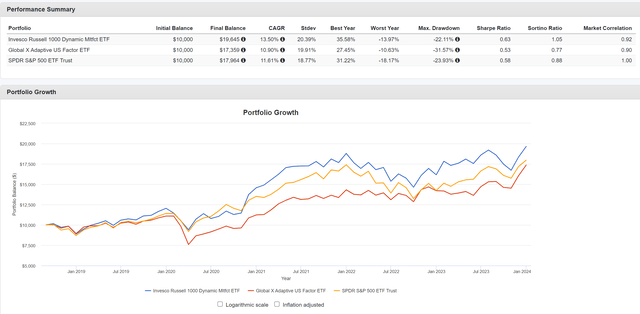
Risk-wise, OMFL has higher volatility compared to AUSF at 20.4% vs. 19.9%, however, OMFL has better risk-adjusted returns with a Sharpe ratio of 0.63 compared to 0.53 for AUSF.
With comparable costs and stronger historical performance, I believe OMFL is the superior multi-factor fund. I also find OMFL’s strategy more intuitive while I worry about AUSF’s strategy at market inflection points. I personally own the OMFL ETF and last wrote about it here.
Conclusion
The Global X Adaptive U.S. Factor ETF uses trailing relative performance to allocate factor weights between Value, Momentum, and Minimum Volatility factors. Historically, the AUSF ETF has delivered strong returns, especially during the 2022 equity bear market when it lost just 0.1% compared to an 18.1% loss for the S&P 500 Index.
However, comparing AUSF against my preferred multi-factor investment fund, the Invesco Russell 1000 Dynamic Multifactor ETF, I believe OMFL’s strategy of matching the fund’s factor allocation to the current phase of the business cycle more intuitive. It also does not suffer from the built-in lag of AUSF’s strategy that uses trailing quarterly relative performance to make its allocation decisions. Historically, OMFL has delivered better absolute and risk-adjusted returns compared to AUSF.
I rate the AUSF a hold.
Credit: Source link