

















• bitcoinBitcoin(BTC)$80,290.002.19%
  • ethereumEthereum(ETH)$2,417.843.68%
  • tetherTether(USDT)$1.000.04%
  • binancecoinBNB(BNB)$716.221.95%
  • rippleXRP(XRP)$1.322.13%
  • usd-coinUSDC(USDC)$1.000.03%
  • solanaSolana(SOL)$96.432.75%
  • tronTRON(TRX)$0.318621-0.35%
  • Figure HelocFigure Heloc(FIGR_HELOC)$1.050.00%
  • zcashZcash(ZEC)$1,317.220.66%
  • HyperliquidHyperliquid(HYPE)$82.24-5.33%
  • dogecoinDogecoin(DOGE)$0.0768451.90%
  • moneroMonero(XMR)$635.76-0.48%
  • USDSUSDS(USDS)$1.000.01%
  • whitebitWhiteBIT Coin(WBT)$77.622.79%
  • chainlinkChainlink(LINK)$11.533.00%
  • leo-tokenLEO Token(LEO)$9.350.36%
  • cardanoCardano(ADA)$0.1980283.15%
  • stellarStellar(XLM)$0.1663101.22%
  • bitcoin-cashBitcoin Cash(BCH)$289.424.60%
  • nearNEAR Protocol(NEAR)$4.02-2.48%
  • daiDai(DAI)$1.000.03%
  • Ethena USDeEthena USDe(USDE)$1.000.08%
  • uniswapUniswap(UNI)$7.40-0.74%
  • litecoinLitecoin(LTC)$55.791.47%
  • RainRain(RAIN)$0.006006-3.46%
  • CantonCanton(CC)$0.1007251.34%
  • avalanche-2Avalanche(AVAX)$8.760.63%
  • suiSui(SUI)$0.920.92%
  • USD1USD1(USD1)$1.00-0.01%
  • tether-goldTether Gold(XAUT)$4,112.462.03%
  • the-open-networkGram (prev. Toncoin)(GRAM)$1.16-2.56%
  • hedera-hashgraphHedera(HBAR)$0.0722731.01%
  • quant-networkQuant(QNT)$202.330.58%
  • Global DollarGlobal Dollar(USDG)$1.000.03%
  • shiba-inuShiba Inu(SHIB)$0.0000051.48%
  • BittensorBittensor(TAO)$234.531.50%
  • paypal-usdPayPal USD(PYUSD)$1.000.01%
  • crypto-com-chainCronos(CRO)$0.0520741.26%
  • Ripple USDRipple USD(RLUSD)$1.000.03%
  • EthenaEthena(ENA)$0.179416-2.82%
  • Ondo US Dollar YieldOndo US Dollar Yield(USDY)$1.15-0.04%
  • okbOKB(OKB)$110.751.56%
  • Circle USYCCircle USYC(USYC)$1.140.01%
  • pepePepe(PEPE)$0.000005-2.20%
  • aaveAave(AAVE)$132.680.33%
  • Pump.funPump.fun(PUMP)$0.004284-3.00%
  • OndoOndo(ONDO)$0.402148-0.88%
  • BlackRock USD Institutional Digital Liquidity FundBlackRock USD Institutional Digital Liquidity Fund(BUIDL)$1.000.00%
  • MemeCoreMemeCore(M)$0.83-3.03%
TradePoint.io
  • Main
  • AI & Technology
  • Stock Charts
  • Market & News
  • Business
  • Finance Tips
  • Trade Tube
  • Blog
  • Shop
No Result
View All Result
TradePoint.io
No Result
View All Result

AUD/USD: The Recent Rally Of The Aussie Dollar May Face A Ceiling Below 0.6900

September 3, 2024
in Market & News
Reading Time: 4 mins read
A A
AUD/USD: The Recent Rally Of The Aussie Dollar May Face A Ceiling Below 0.6900
ShareShareShareShareShare

TexPhoto

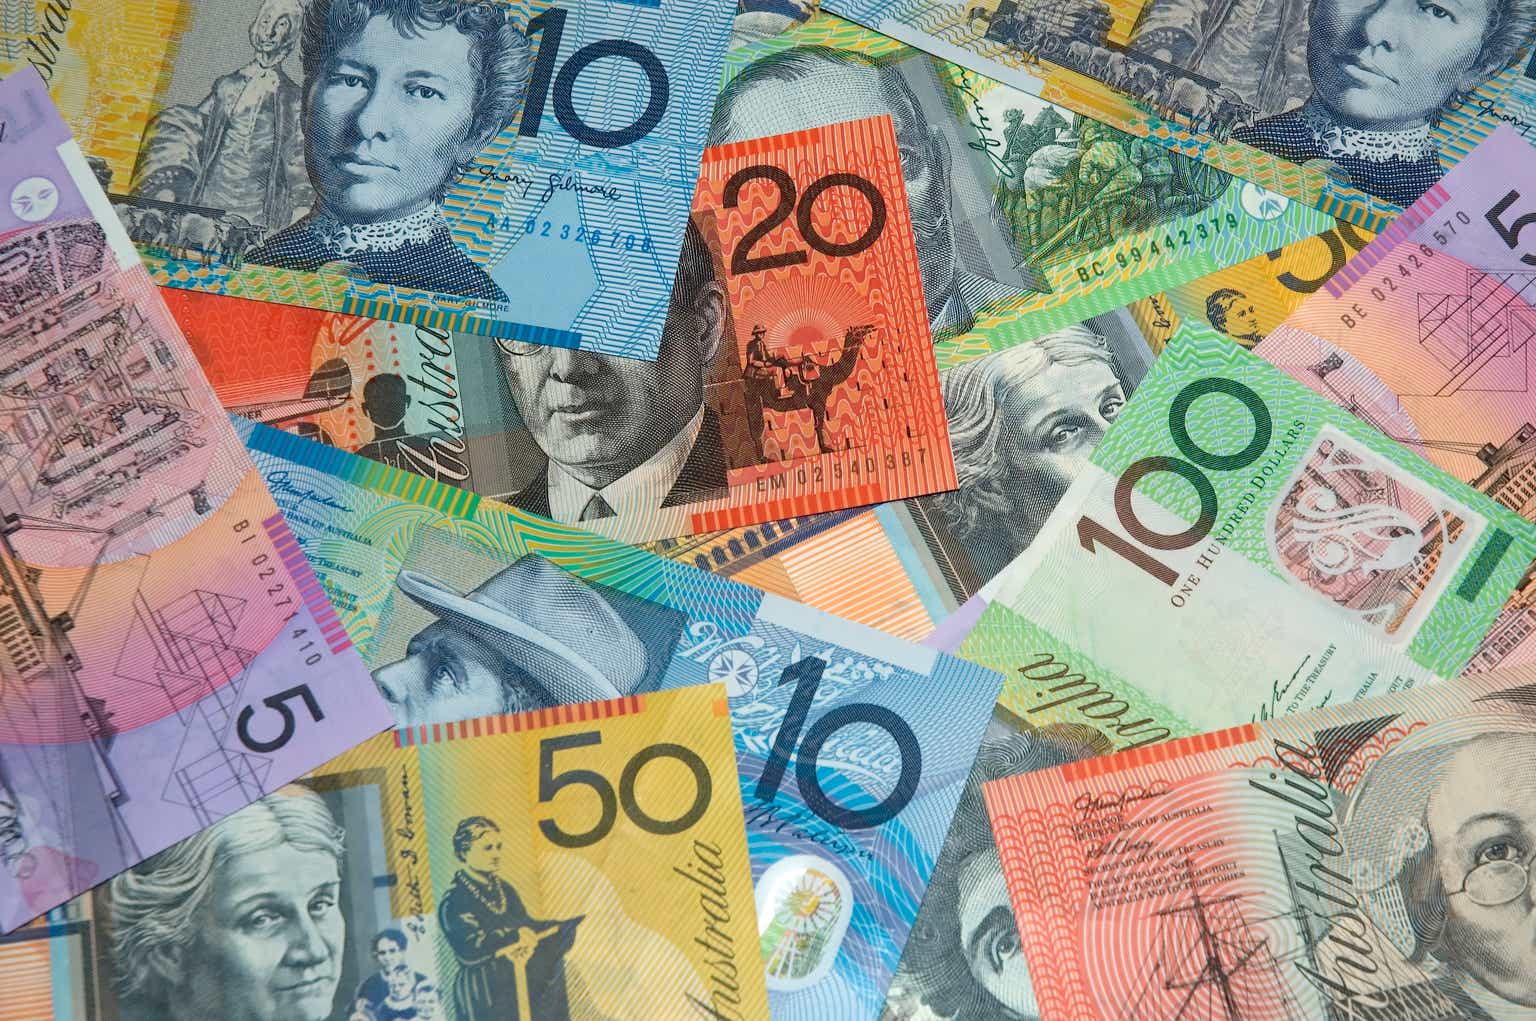
After the global risk-off episode that occurred from mid-July to 5 August, the Aussie dollar has managed to recover all its losses against the US dollar in the same period.

The AUD/USD, being a higher-beta play among the FX majors rose by 7.4% from its 5 August low of 0.6348 to print a recent high of 0.6824 on 29 August reinforced by a clear switch of monetary policy stance by the US Federal Reserve from “hawkish-higher for longer” to “dovish-time has come for policy to adjust” ex-post Fed Chair Powell’s 23 August Jackson Hole Symposium speech that cemented a potential upcoming 25 basis points cut to the Fed funds rate on the 18 September FOMC meeting.

Weak macro data from China is in the limelight again

The latest China NBS Manufacturing PMI data for August has pointed to a fourth consecutive month of contraction in manufacturing activities; it slipped further to 49.1 from 49.4 in July, below the consensus of 49.5.

Its new orders subcomponent declined at a slightly higher magnitude from 49.30 in July to 48.90 in August which is an alarming cause of concern as a significant portion of China’s economic growth so far in 2024 has been driven by external demand and top policymakers’ heavy allocation of state resources towards China’s high-tech industrialization programme.

If China’s manufacturing activities languish at this rate in Q4, it is unlikely that China can meet its 5% annualized economic growth target for 2024. In addition, a weak state of manufacturing production coupled with the housing market in China that is still not showing any clear signs of stabilization from a persistent trend of negative growth rates (value of new home sales from the 100 biggest real estate firms plunged to 26.8% y/y in August from -19.7% in July), there is likely less demand for industrial metals such as iron ore.

Iron ore prices have moved in direct lockstep with AUD/USD
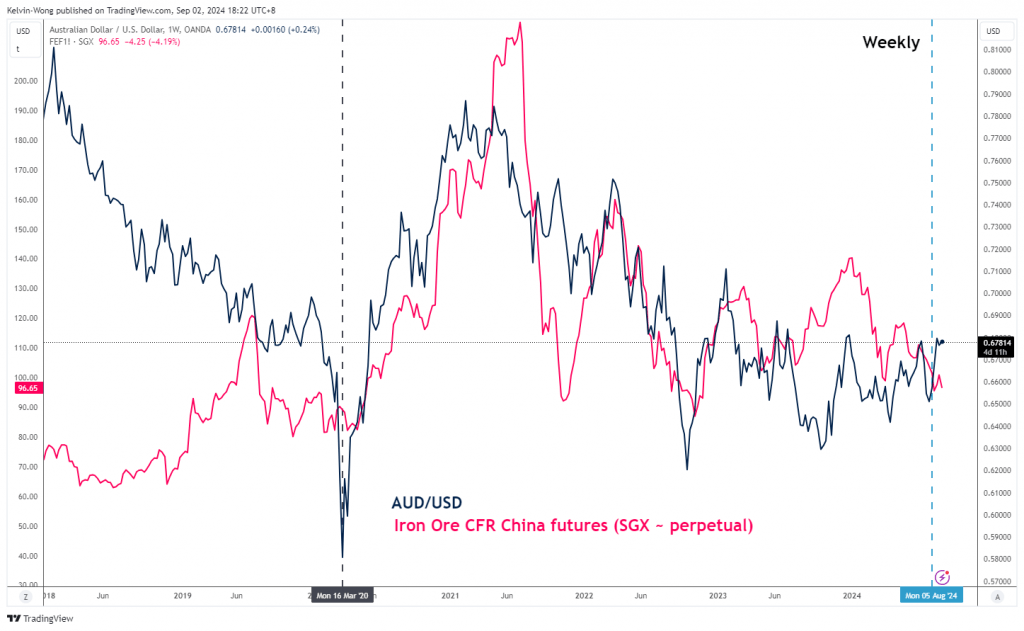
Iron ore prices have moved in direct lockstep with AUD/USD

Fig 1: AUD/USD & Iron Ore futures correlation movement as of 2 Sep 2024 (Source: TradingView)

Given that iron ore is one of Australia’s key resource exports and a significant portion of it goes to China, if China’s economic growth languishes, there will be likely less demand for iron ore, in turn, put downside pressure on Australia’s trade balance that may trigger a negative feedback loop into the AUD/USD.

YOU MAY ALSO LIKE

Stoneridge's Growth Can Take It Higher, Maintain Buy

The blue wave swamped Trump’s redistricting wall – Politico

Since March 2020, the movement of the Iron Ore CFR China futures contract listed on the Singapore Exchange has a positive correlation with the AUD/USD. However, this positive correlation flipped to negative for a short period recently from 5 August to 29 August due to the resurgence of global risk-on behaviour (see Fig 1).

Given that China’s lacklustre economic growth narrative is back on the radar screen again, the Iron Ore CFR China futures contract (SGX) has declined by -4.2% on Monday at the time of the writing, its longer-term positive correlation movement with AUD/USD may come back to influence the movement of the Aussie dollar.

AUD/USD rally has almost reached its 0.6900 major resistance
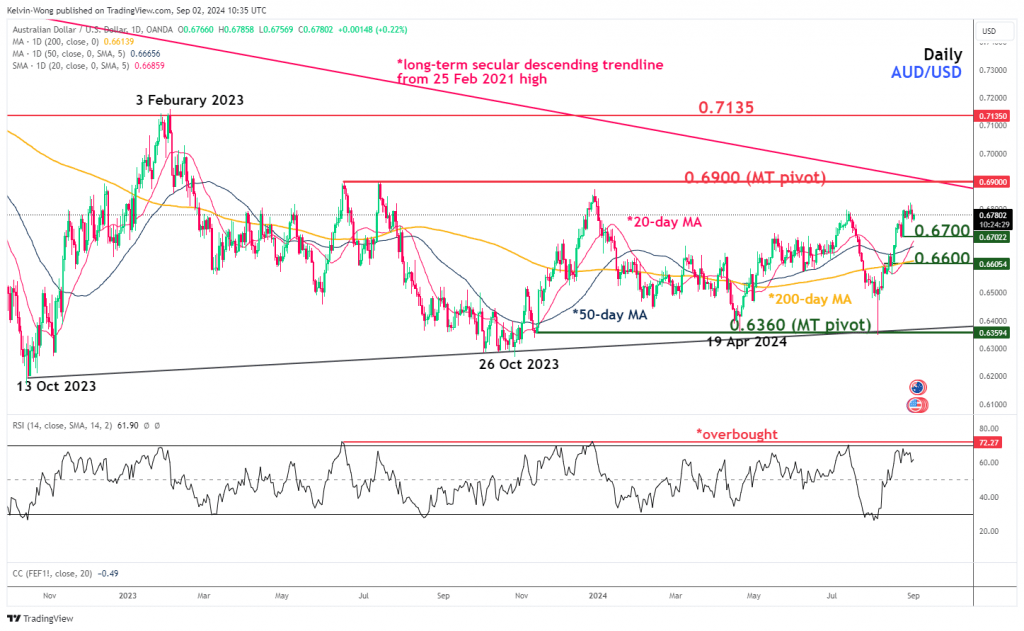
AUD/USD rally has almost reached its 0.6900 major resistance

Fig 2: AUD/USD major & medium-term trends as of 2 Sep 2024 (Source: TradingView)

The recent rally of 7.4% from its 5 August low seen in AUD/USD has now almost reached a major resistance of 0.6900 (the medium-term swing highs of 16 June/13 July 2023 and long-term secular descending trendline from the 25 February 2021 high).

In addition, the daily RSI momentum indicator has almost hit an overbought level of 72 which has capped prior advances of the AUD/USD since 15 June 2023.

If the 0.6900 key medium-term pivotal resistance is not surpassed to the upside, the AUD/USD may see a mean reversion decline scenario unfolding to expose the next intermediate supports at 0.6700 and 0.6600 (also the 200-day moving average) (see Fig 2).

However, a clearance above 0.6900 invalidates the bearish scenario on the AUD/USD for the next intermediate resistance to come in at 0.7135.

Original Post

Editor’s Note: The summary bullets for this article were chosen by Seeking Alpha editors.

Credit: Source link

ShareTweetSendSharePin

Related Posts

Stoneridge's Growth Can Take It Higher, Maintain Buy
Market & News

Stoneridge's Growth Can Take It Higher, Maintain Buy

November 5, 2026
The blue wave swamped Trump’s redistricting wall – Politico
Market & News

The blue wave swamped Trump’s redistricting wall – Politico

November 5, 2026
Why Are Bond Yields Climbing?
Market & News

Why Are Bond Yields Climbing?

November 5, 2026
Bob Dylan comes knockin’ on pope’s door as Leo welcomes legend to Vatican – NBC News
Market & News

Bob Dylan comes knockin’ on pope’s door as Leo welcomes legend to Vatican – NBC News

November 5, 2026
Next Post
Setting Up My Webull Stock Scanner In 5 Mins: Oversold Reversal Setup

Setting Up My Webull Stock Scanner In 5 Mins: Oversold Reversal Setup

Leave a Reply Cancel reply

Your email address will not be published. Required fields are marked *

Search

No Result
View All Result
AI to Drive 40% Growth for AWS: CEO Garman

AI to Drive 40% Growth for AWS: CEO Garman

November 3, 2026
Why Trump is campaigning in reliably red states

Why Trump is campaigning in reliably red states

October 30, 2026
Canelo Alvarez vs. Christian Mbilli live results, round-by-round updates, ring walks for today's title fight – Yahoo Sports

Canelo Alvarez vs. Christian Mbilli live results, round-by-round updates, ring walks for today's title fight – Yahoo Sports

October 31, 2026

About

Learn more

Our Services

Legal

Privacy Policy

Terms of Use

Bloggers

Learn more

Article Links

Contact

Advertise

Ask us anything

©2020- TradePoint.io - All rights reserved!

Tradepoint.io, being just a publishing and technology platform, is not a registered broker-dealer or investment adviser. So we do not provide investment advice. Rather, brokerage services are provided to clients of Tradepoint.io by independent SEC-registered broker-dealers and members of FINRA/SIPC. Every form of investing carries some risk and past performance is not a guarantee of future results. “Tradepoint.io“, “Instant Investing” and “My Trading Tools” are registered trademarks of Apperbuild, LLC.

This website is operated by Apperbuild, LLC. We have no link to any brokerage firm and we do not provide investment advice. Every information and resource we provide is solely for the education of our readers. © 2020 Apperbuild, LLC. All rights reserved.

No Result
View All Result
  • Main
  • AI & Technology
  • Stock Charts
  • Market & News
  • Business
  • Finance Tips
  • Trade Tube
  • Blog
  • Shop

© 2023 - TradePoint.io - All Rights Reserved!