
RapidEye/E+ via Getty Images
Introduction
Atkore (NYSE:ATKR) provides industrial piping and electrical cabled conduit for a number of sectors but is largely exposed to US commercial construction generally. Atkore is split into two business units, “Electrical” and “Safety & Infrastructure”. Electrical sells electrical cabling such as PVC tubes, metal/armoured cables, HDPE, fittings, nipples and other connectors. In Q3, this segment done $606m in sales vs $217m in Safety & Infrastructure. Thus, top-line exposure is split 73-27.
Safety & Infrastructure products include larger metal or resin piping used for water utilities, communication lines, renewable energy applications etc.
Atkore is a cyclical business, with average selling prices and volume determining quarterly margins and profitability. Over the past 8 years, you can see in the chart below, gross (orange) and operating (blue) margins expanded aggressively post-covid as ASP’s for Atkore’s products increased due to strong demand and low-interest rates which incentivised construction activity.
Bloomberg Terminal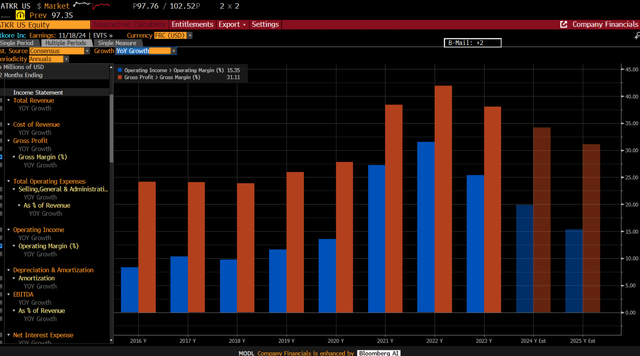
It’s a fair argument to say that Atkore was significantly ‘over earning’ during 2022. Today we are in a period of normalisation at least in terms of margin which is mostly a product of ASP’s and direct raw material costs such as resin and CRU index prices especially steel.
However in the chart above you can still see operating margins are expected to around 15% in FY25, above the longer-term average. The sell-side estimates indicate, based on their understanding of the construction market – margins will remain somewhat attractive, implying resilient demand for Atkore’s products.
Atkore is also been more focused on higher margin products as their key product line, PVC conduit, is seeing increased supply dynamics and market shares loses due to growing Mexican PVC conduit imports into the US (also China has some share). Right now, Atkore is experiencing in a period of weaker demand; however, there are signs that the industry will see higher demand (greater volume at least) in the years ahead. One key tailwind is data centre construction, which is an ongoing secular trend and is a vital end-segment for Atkore’s products.
DMI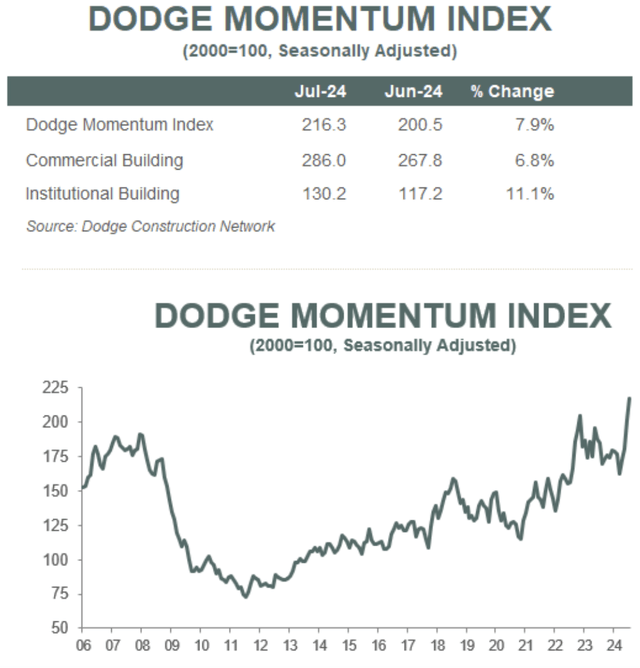
The Dodge Momentum Index (DMI) tracks the non-residential construction projects in planning, which indicates construction activity over the next 1-2 years. DMI has been a reliable indicator in the past and today is still a useful index used by investors and industry operators. The Dodge database is the largest database of construction projects, populated by reporters in more than 80 major metro areas across the United States.
The rapid increase in the DMI could be the main reason why analysts are guiding Atkore’s margins in FY25/FY26 as being above their historical average pre-2020. Although there’s still concerns over supply capacity, which would likely keep prices stable despite higher demand. As a note – the well documented US office real estate problem doesn’t need to recovery for Atkore to see an uptick in demand (Atkore is all new business – no reinstall dynamics). Today, more is spent on electrical related infrastructure (CHIPS act) than it did over the past 20+ years.
IGN / Macrobond – Non-residential construction spending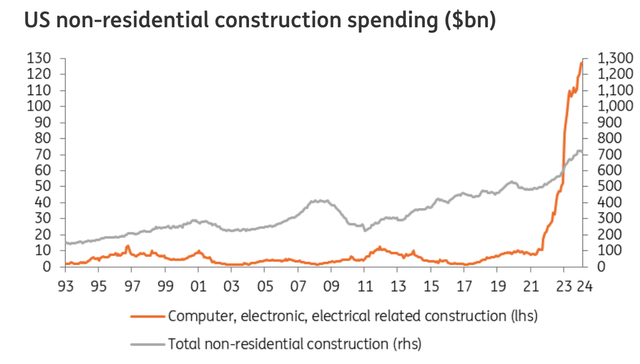
The data centre build out in particular will benefit Atkore as one of the niche supplies of metal/plastic conduit, cables, electrical connectors and metal frames used in data centres.
Another factor to consider is how interest rates affect construction project activity. The futures market suggests that the Federal Funds Rate will be around 3.2% in 12 months, which will be a positive factor for construction generally across the US.
Implied Policy Rate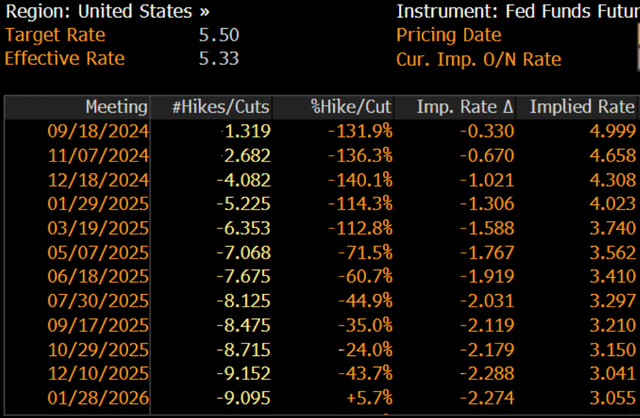
Valuation Suggests Moderately Undervalued
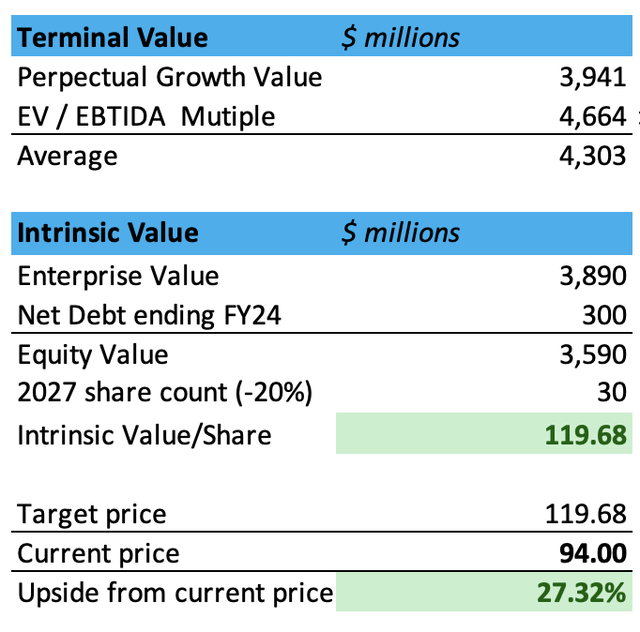
A 5-yr DCF suggest the equity value per share should be roughly 33% higher than the current price (please see assumptions further below). This includes a 20% reduction in share count (30m shares outstanding) by 2027 which is a possible exit year. This is more than reasonable due to Atkore’s historically aggressive buybacks, after authorising a $1.3bn multi-year buyback, the board approved another $500m buyback in May this year which will be available once the remaining buyback programme ($1.3bn) is completed. Below is the number of shares outstanding QoQ since 2016 (Y-axis is NOT scaled from 0).
Bloomberg Terminal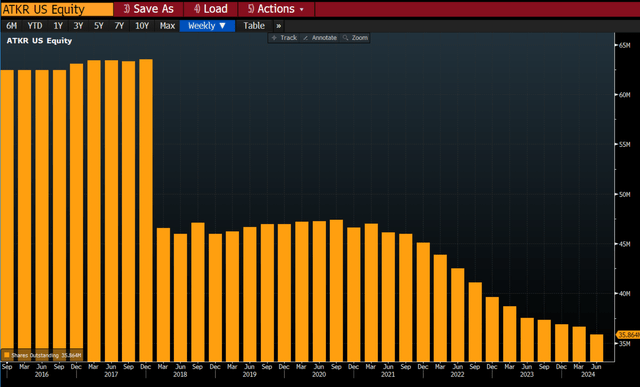
I’d argue Atkore is one of the best buyback plays I’ve ever seen the small-cap universe. Although I don’t think Atkore will be able to successfully reduce their share count at the same pace YoY (for long periods) as shares would eventually re-rate, reducing the effectiveness of buybacks. However there’s also a possibility that 2025 will be weaker than expected, thereby adding selling pressure, allowing management to scoop up a higher % of shares.
Created by Author 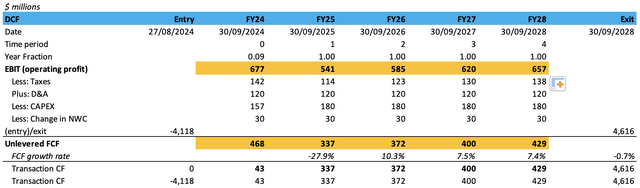
Based on these assumptions which are broadly inline with sell-side consensus and assuming net debt of $300m, the shares could be worth $119 which is about 27% higher than the current share price of $94. This would assume the Atkore stays more profitable than pre-covid in 2025 and sees a steady recovery from 2025 onwards.
Created by Author Created by Author 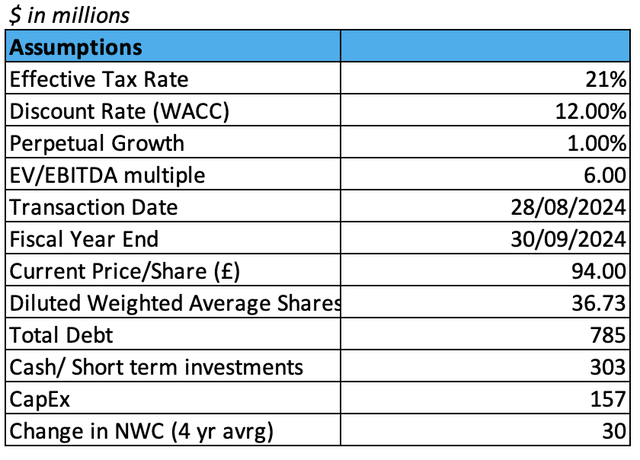
Looking at the sensitivity analysis below, an extremely conservative valuation might be around $96-109 per share and a rich valuation of around $157-$195 per share.
Created by Author 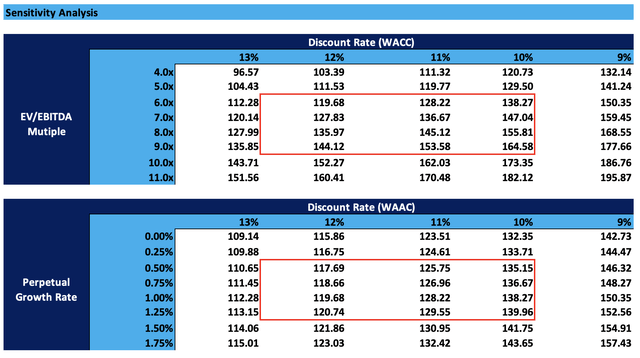
The historical EV/EBITDA trades in a range of 4x – 8x due to the cyclical nature of their industry, but the historical mean is 6x, which is what I’ve assumed in the initial intrinsic value calculation. In the chart below, EV/EBITDA LTM and EV/EBITDA NTM have diverged, suggesting the market has largely discounted the probability that Atkore will hit future guidance and investors are cautious on the company.
Created by Author 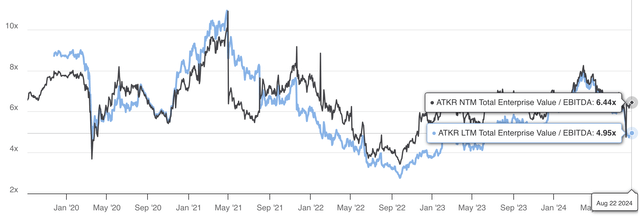
Atkore has a term loan of $373m due in 2028 and senior notes of $400m due in 2031, also the company has an undrawn RCF of $325 that ends in 2026. Other balance metrics show a robust balance sheet allowing flexibility for buybacks;
– Q3 Net debt / EBITDA = 0.77x (including capital leases)
– Q3 Current ratio = 3.26x
– Q3 Quick ratio = 1.73x
– S&P / Moody’s = BB+ / Ba1 (highest quality ‘speculative’ rating)
Conclusion
Atkore shares sold off this year as they missed quarterly guidance and lowered their outlook due to lower price’s across their portfolio. While it is clear Atkore was over-earning between 2021-2023 and is now in a period of normalisation, I don’t think Atkore experiences the margins or earnings it had between 2016-2019 going forward. My argument is commercial construction activity is likely to tick higher over the coming years, which will put a bottom in pricing in 2025.
Despite the commoditised nature of Atkore’s products, it is clear based on non-residential construction spending, the DMI index, and future Interest Rate dynamics that Atkore will likely be in a good position if the data continues in the right direction. Although one concern is, Atkore doesn’t have any clear catalysts in the short term; therefore the shares could easily continue on a downward trajectory. If Atkore shares trend towards $80s or possibly $70s the proposal becomes incredibly attractive and management can take advantage in such a scenario (buybacks) but only with current cash on hand which sits at $303m.
Also, Atkore currently has an estimated dividend of $0.49 for FY24 (Fiscal year ends in September), which indicates a yield of 0.52%, potentially increasing to 0.69% in FY25.
Credit: Source link