• bitcoinBitcoin(BTC)$78,408.00-0.76%
  • ethereumEthereum(ETH)$2,332.16-2.61%
  • tetherTether(USDT)$1.000.00%
  • rippleXRP(XRP)$1.43-1.18%
  • binancecoinBNB(BNB)$639.63-1.25%
  • usd-coinUSDC(USDC)$1.00-0.02%
  • solanaSolana(SOL)$86.15-2.03%
  • tronTRON(TRX)$0.3297520.24%
  • Figure HelocFigure Heloc(FIGR_HELOC)$1.040.09%
  • dogecoinDogecoin(DOGE)$0.097103-0.44%
  • whitebitWhiteBIT Coin(WBT)$55.37-1.51%
  • USDSUSDS(USDS)$1.00-0.01%
  • HyperliquidHyperliquid(HYPE)$41.651.52%
  • leo-tokenLEO Token(LEO)$10.291.53%
  • cardanoCardano(ADA)$0.250426-1.39%
  • bitcoin-cashBitcoin Cash(BCH)$458.30-1.41%
  • moneroMonero(XMR)$376.090.25%
  • chainlinkChainlink(LINK)$9.34-1.27%
  • stellarStellar(XLM)$0.178297-0.45%
  • CantonCanton(CC)$0.150608-1.80%
  • MemeCoreMemeCore(M)$4.26-1.52%
  • zcashZcash(ZEC)$325.91-0.18%
  • daiDai(DAI)$1.00-0.01%
  • USD1USD1(USD1)$1.00-0.03%
  • litecoinLitecoin(LTC)$55.73-0.87%
  • Ethena USDeEthena USDe(USDE)$1.000.00%
  • avalanche-2Avalanche(AVAX)$9.39-1.24%
  • hedera-hashgraphHedera(HBAR)$0.090862-1.77%
  • suiSui(SUI)$0.95-2.06%
  • shiba-inuShiba Inu(SHIB)$0.000006-1.32%
  • RainRain(RAIN)$0.007586-2.64%
  • paypal-usdPayPal USD(PYUSD)$1.000.01%
  • the-open-networkToncoin(TON)$1.33-2.64%
  • crypto-com-chainCronos(CRO)$0.070054-0.82%
  • Circle USYCCircle USYC(USYC)$1.12-0.09%
  • tether-goldTether Gold(XAUT)$4,711.19-0.01%
  • BlackRock USD Institutional Digital Liquidity FundBlackRock USD Institutional Digital Liquidity Fund(BUIDL)$1.000.00%
  • World Liberty FinancialWorld Liberty Financial(WLFI)$0.077831-2.21%
  • BittensorBittensor(TAO)$246.580.95%
  • Global DollarGlobal Dollar(USDG)$1.00-0.02%
  • pax-goldPAX Gold(PAXG)$4,714.440.01%
  • mantleMantle(MNT)$0.640.11%
  • polkadotPolkadot(DOT)$1.25-3.59%
  • uniswapUniswap(UNI)$3.30-3.13%
  • SkySky(SKY)$0.0843930.16%
  • nearNEAR Protocol(NEAR)$1.41-0.42%
  • Falcon USDFalcon USD(USDF)$1.00-0.15%
  • okbOKB(OKB)$84.03-1.28%
  • Pi NetworkPi Network(PI)$0.168046-0.67%
  • AsterAster(ASTER)$0.68-1.17%
TradePoint.io
  • Main
  • AI & Technology
  • Stock Charts
  • Market & News
  • Business
  • Finance Tips
  • Trade Tube
  • Blog
  • Shop
No Result
View All Result
TradePoint.io
No Result
View All Result

ANGL: Seeking An Edge In Downgraded Corporate Bonds (NASDAQ:ANGL)

April 21, 2026
in Market & News
Reading Time: 9 mins read
A A
ANGL: Seeking An Edge In Downgraded Corporate Bonds (NASDAQ:ANGL)
ShareShareShareShareShare

Dzmitry Skazau/iStock via Getty Images

Fast Facts About the Van Eck Fallen Angel High Yield Bond ETF

The VanEck Fallen Angel High Yield Bond ETF (ANGL) was launched on April 10, 2012 and tracks the ICE US Fallen Angel High Yield 10% Constrained Index. ANGL has an expense ratio of 0.25%, a portfolio of 132 securities, a trailing 12-month yield of 6.28%, a yield to maturity of 6.53% and a 30-day SEC yield of 6.63%. Distributions are paid on a monthly basis. ANGL is quite a large and liquid ETF, with about $3 billion in assets under management (“AUM”) and $30 million in average daily trading volume. The sponsor VanEck is an investment management firm primarily focused on ETFs with about $200 billion in total AUM.

What are fallen angels bonds?

Fallen angels bonds are below investment grade corporate bonds (often referred to as “junk bonds”) that previously had an investment grade. Multiple studies conclude that companies having lost their investment grade rating have a lower risk of default than those initially issued below investment grade. In particular:

  • NYU Stern Professor Edward Altman found that fallen angels had an average annual default rate about 1% lower than the broader high-yield market between 1985 and 2017.
  • A VanEck whitepaper reports that fallen angels had a 2.6% average default rate compared to 3.3% for the broader high-yield market between 1999 and 2020.
  • A product leaflet by BNY Mellon claims that the high yield annual average default rate was 2.47% between 2004 and 2024, versus 1.71% for fallen angels.

As the survivor rate compounds year after year, such small gaps can make a significant difference in the long term. Additionally, a study by Fitch Ratings reports that issuers downgraded due to a recession or industry-specific factors have a 61% probability to regain their investment-grade status.

Therefore, a fallen angels bond ETF is expected to have a better risk-adjusted performance than a broader junk bond ETF.

ANGL’s strategy

As described by VanEck, the underlying index targets below investment grade corporate bonds that were rated investment grade at the time of issuance, denominated in U.S. dollars and issued in the U.S. market. Bonds issued below investment grade by a company with securities already included in the index may be eligible. Defaulted securities are excluded from the index at the end of the month in which they default. Eligible securities must be issued by companies incorporated in a list of developed countries defined by the index provider. The portfolio turnover rate was 43% in the most recent fiscal year and 71% in the previous year.

Portfolio

ANGL is mostly invested in debt of U.S. companies (72.2% of asset value). No other country weighs more than 7%. The portfolio has a focus on consumer cyclical companies (31%) and significant exposure in materials (19%) and technology (16%). Other sectors are below 10%.

Sector breakdown

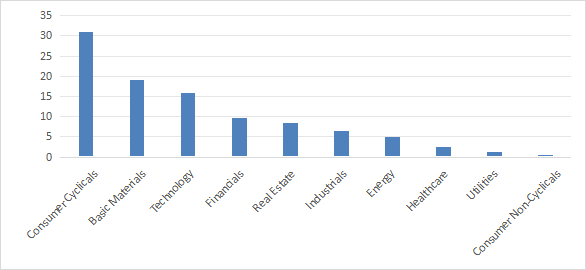
Sector breakdown (Chart: author; data: VanEck)

Over 80% of asset value has a BB rating, the highest quality category of junk bonds.

Credit quality profile

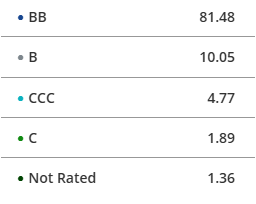
Credit quality profile (VanEck)

The portfolio has an average maturity of 10.2 years, with 48% of assets below 5 years.

Maturity profile

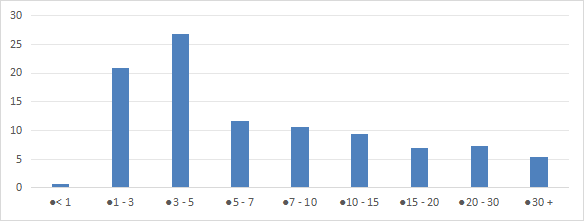
Maturity profile (Data: VanEck)

Sensitivity to rate variations is moderate, with an effective duration of 4.6 years. It means the portfolio’s asset value would change by approximately 4.6% for every 1% change in interest rates, in the opposite direction.

The next table lists the top 10 issuers with a weighting 53.2% of net asset value. The top three names (Paramount, Nissan and Celanese) are between 8.6% and 10.3%, representing notable company-specific risk.

Company

Country

Weight

Paramount Global

US

10.29%

Nissan Motor Co Ltd

Japan

9.85%

Celanese Us Holdings Llc

US

8.60%

Fs Kkr Capital Corp

US

5.20%

Whirlpool Corp

US

4.18%

Telecom Italia Capital Sa

Italy

3.46%

Vodafone Group Plc

UK

3.29%

Nordstrom Inc

US

2.95%

Vf Corp

US

2.74%

Rockies Express Pipeline Llc

US

2.65%

This is an example from April 21, 2026, holdings and weights may have changed by the time you read this.

Performance

ANGL has outperformed the benchmark iShares iBoxx $ High Yield Corporate Bond ETF (HYG) by 1.9% annualized from 4/17/2012 to 4/21/2026. It has higher risk metrics (maximum drawdown and volatility in the table below), but keeps the lead in risk-adjusted performance (Sharpe ratio).

Total Return

Annual.Return

Drawdown

Sharpe ratio

Volatility

ANGL

144.93%

6.60%

-35.07%

0.57

8.63%

HYG

91.40%

4.74%

-22.03%

0.43

7.04%

Data: Portfolio123

The gap is also 1.9% over the past 12 months, with a lower Sharpe ratio in this time frame:

12 months

Total Return

Drawdown

Sharpe ratio

Volatility

ANGL

12.43%

-4.05%

0.84

4.77%

HYG

10.57%

-2.34%

1.13

2.81%

The share price has gained 14.9% from inception to 4/21/2026, while HYG lost 10.8%, as plotted on the next chart. This demonstrates how a fallen angels bond portfolio may be superior to a broad high yield bond portfolio for asset value preservation.

ANGL price return

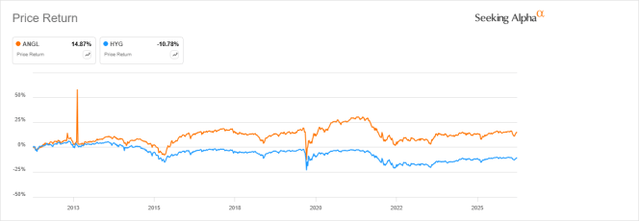
ANGL price return (Seeking Alpha)

The annual sum of distributions has increased by 29% over the past 10 years. Even though it was not a steady trend, as plotted on the chart below, it is much better than HYG, whose distributions decreased by 3% in the same time.

YOU MAY ALSO LIKE

From shoes to AI: Why Allbirds is pivoting and changing its business

Morning News NOW Full Episode – April 16

ANGL distribution history

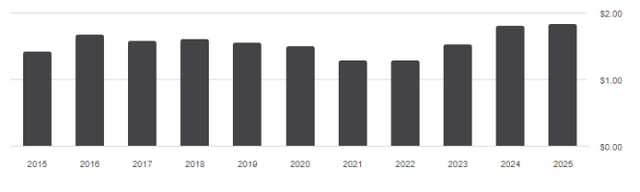
ANGL distribution history (Seeking Alpha)

Competitors

The next table compares characteristics of ANGL and two other fallen angels bond ETFs:

  • iShares Fallen Angels USD Bond ETF (FALN)
  • Invesco Bloomberg Enhanced Fallen Angels ETF (IFLN)

IFLN changed names, tickers and strategies on February 23, 2026: data prior to this date are irrelevant to assess the fund. It was previously known as Invesco Fundamental High Yield Corporate Bond ETF (PHB) and its strategy was based on the fundamentals of the issuers.

ANGL

FALN

IFLN

Inception

04/10/2012

06/14/2016

11/13/2007

Expense Ratio

0.25%

0.25%

0.50%

AUM

$3.05B

$1.86B

$286.31M

Avg Daily Volume

$29.80M

$37.17M

$3.77M

Yield TTM

6.28%

6.38%

irrelevant

Div. Growth 5 Yr CAGR

4.58%

3.88%

//

Total Return*

80.81%

84.19%

//

Annual Return*

6.21%

6.41%

//

Drawdown*

-29.31%

-29.22%

//

Sharpe ratio*

0.41

0.41

//

Volatility*

9.04%

9.61%

//

* calculated with Portfolio123 from 6/21/2016.

ANGL and FALN have the same fees and Sharpe ratios, and similar yields and drawdowns. FALN is marginally ahead in annualized return (by 20 bps).

Takeaway

VanEck Fallen Angel High Yield Bond ETF (ANGL) pays a 6% yield via a portfolio of junk bonds that were issued as investment grade. ANGL is well-suited for long-term or tactical allocation in high-yield bonds, and offers a statistical edge over broad high-yield bond ETFs.

  • Pros: moderate credit and interest rate risks, capital preservation, beats HYG.
  • Cons: concentration in the top issuers.

This article answers these three main questions about ANGL:

  1. What type of investor is ANGL best suited for?
  2. How is the ANGL portfolio structured?
  3. How does ANGL compare to its benchmark and competitors?

Editor’s note: This article is intended to provide a general overview of the ETF for educational purposes only and, unlike other articles on Seeking Alpha, does not offer an investment opinion about the ETF.

Credit: Source link

ShareTweetSendSharePin

Related Posts

From shoes to AI: Why Allbirds is pivoting and changing its business
Market & News

From shoes to AI: Why Allbirds is pivoting and changing its business

April 23, 2026
Morning News NOW Full Episode – April 16
Market & News

Morning News NOW Full Episode – April 16

April 23, 2026
Celestica: The Market Is Missing What Alphabet Just Confirmed
Market & News

Celestica: The Market Is Missing What Alphabet Just Confirmed

April 23, 2026
Wall St slips on Middle East impasse, mixed earnings – Reuters
Market & News

Wall St slips on Middle East impasse, mixed earnings – Reuters

April 23, 2026
Next Post
7.7-magnitude earthquake strikes off Japan’s coast

7.7-magnitude earthquake strikes off Japan's coast

Leave a Reply Cancel reply

Your email address will not be published. Required fields are marked *

Search

No Result
View All Result
Tornado Watch for entire Chicago area as severe storms race east; tornadoes, funnel clouds reported northwest – CBS News

Tornado Watch for entire Chicago area as severe storms race east; tornadoes, funnel clouds reported northwest – CBS News

April 18, 2026
Mass exodus from California is driven by poorer people — now they’re thriving

Mass exodus from California is driven by poorer people — now they’re thriving

April 21, 2026
What travelers can do as the Iran war impacts flight costs and availability

What travelers can do as the Iran war impacts flight costs and availability

April 19, 2026

About

Learn more

Our Services

Legal

Privacy Policy

Terms of Use

Bloggers

Learn more

Article Links

Contact

Advertise

Ask us anything

©2020- TradePoint.io - All rights reserved!

Tradepoint.io, being just a publishing and technology platform, is not a registered broker-dealer or investment adviser. So we do not provide investment advice. Rather, brokerage services are provided to clients of Tradepoint.io by independent SEC-registered broker-dealers and members of FINRA/SIPC. Every form of investing carries some risk and past performance is not a guarantee of future results. “Tradepoint.io“, “Instant Investing” and “My Trading Tools” are registered trademarks of Apperbuild, LLC.

This website is operated by Apperbuild, LLC. We have no link to any brokerage firm and we do not provide investment advice. Every information and resource we provide is solely for the education of our readers. © 2020 Apperbuild, LLC. All rights reserved.

No Result
View All Result
  • Main
  • AI & Technology
  • Stock Charts
  • Market & News
  • Business
  • Finance Tips
  • Trade Tube
  • Blog
  • Shop

© 2023 - TradePoint.io - All Rights Reserved!