

BackyardProduction
Over the 2010-2021 timeframe, markets tended to be extremely generous with multiples for growth companies. If you produced growth, investors were ready to look far into the future to come up with a semblance of a reasonable end result. This silliness reached its peak in 2021. Just have a look at the bullish cases for SPACs and recent IPOs of the time. Most investors were making bullish cases based on 2030 revenues. They had to, because people would have to be insane to buy them for the 2023 numbers. This mania reversed in 2022 and for a good deal of companies (at least any company without an AI mention), shows no signs of coming back.
The Company
American Tower Corporation (NYSE:AMT) is one where investors ran with the growth story and ran too far with it. As a leading owner of towers, the story was easy to cell.
AMT Presentation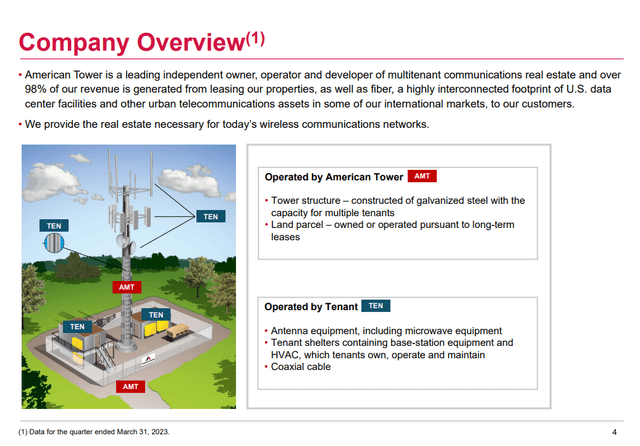
The name of the game was leverage. 3 tenants were far more profitable than three times the profits for one tenant.
AMT Presentation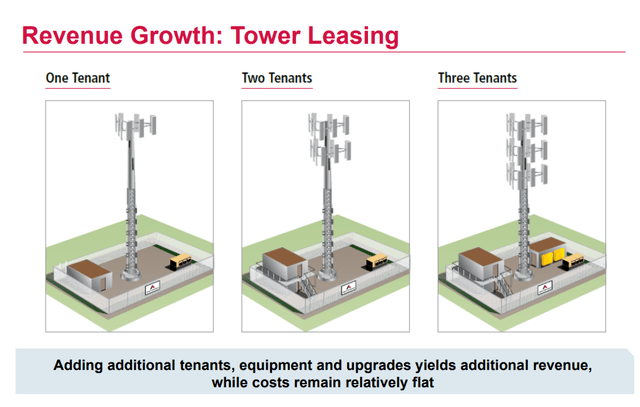
AMT broke this math further for everyone so you could see the numbers they were talking about.
AMT Presentation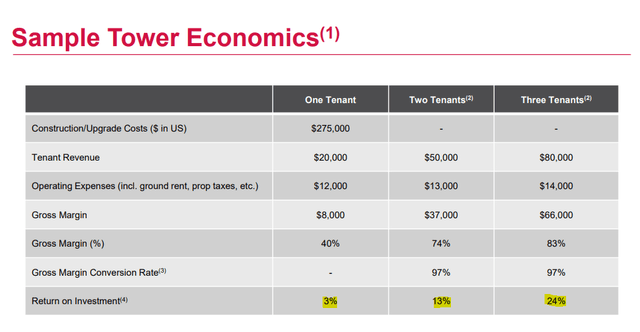
This was all true and AMT has been a genuine success story over the 2010-2022 period. The numbers were simply stunning including a 20% compounded dividend growth!
AMT Presentation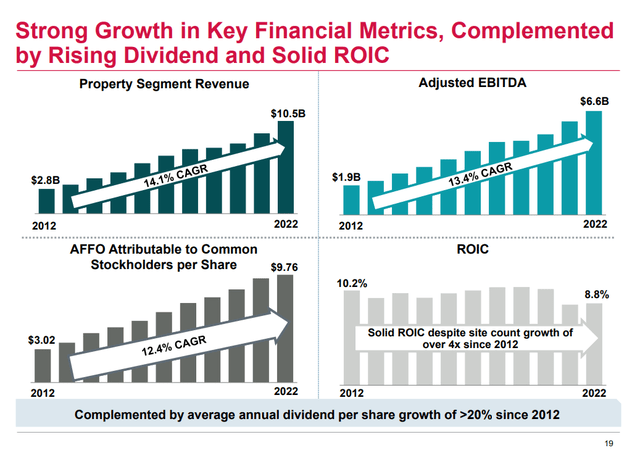
But the longer things go this well, the bigger the blowback is when they stop going so well.
A Valuation Ride
As with most of our work, we focus on the big valuation picture. If you want more granular detail on the latest tower built or the minutiae around the 1% movement in revenue outlook, this is not the place to find it. The big picture is what drives investing for us and the key reason why we have not touched this despite the crowd going mad for this. That big picture also shows why this is headed lower. Let us explain.
If you look at the slide above, it looks like a hard story not to love. But your return profile could be really different than what those numbers show. While those revenue, adjusted EBITDA and adjusted funds from operations (AFFO) trajectories look very consistent, the multiples investors paid for this were anything but. Here is one data point. Investors pushed AMT down to $88 in 2016.
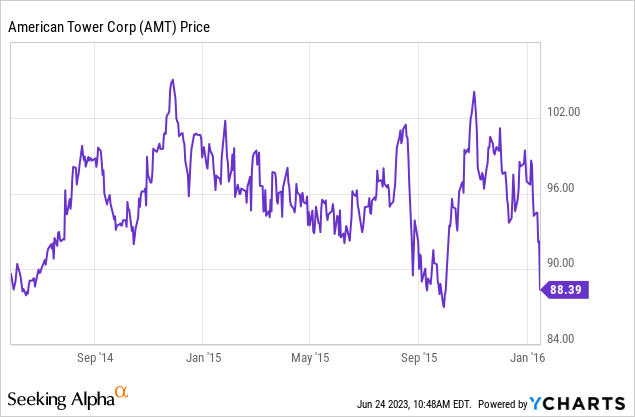
That would be close to 15.2 times what would turn out to be the AFFO for 2016. If you used the Q4-2016 run-rate you were paying less than 14.5X AFFO.
Q4-2016 Results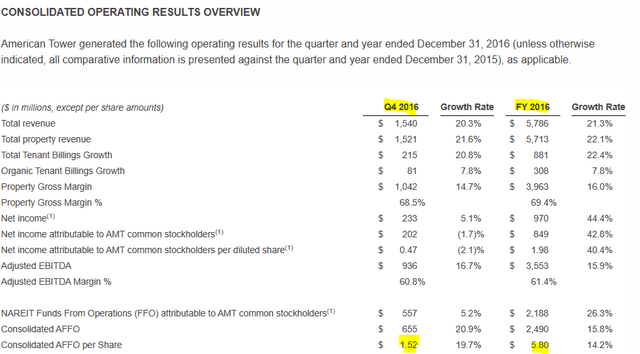
Fast forward to 2021 and investors had just finished going raving mad, bidding AMT up to over $303 a share.
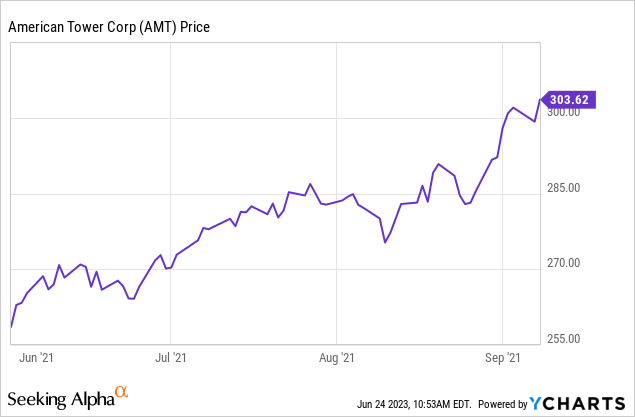
That was 30X the AFFO (annualized) for the Q3-2021 quarter.
Q3-2021 Results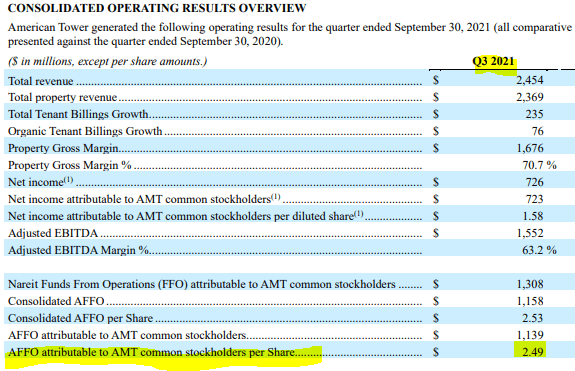
Our point is that we saw almost 100% multiple range for a consistently growing stock. So investors constantly arguing a “buy-story” at every single point, without regard to valuation, can run into trouble. That is precisely what happened after the last growth groupies were sucked in.
Where Are We Today?
In the most recent quarter AMT reported AFFO of $2.54.
Q1-2023 Results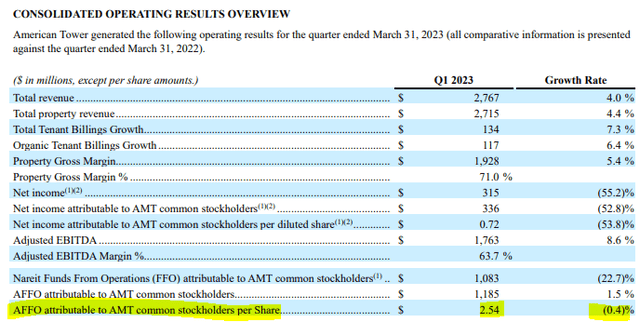
You don’t have to have a great memory to note that over 6 quarters from Q3-2021, the AFFO has barely budged. It gets worse for the growth story. 2023 guidance is now for a 1.1% decline in AFFO per share vs 2022.
Q1-2023 Results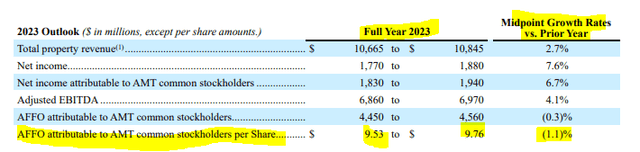
Exit run rates are again below the Q3-2021 numbers we showed you. It is truly stunning how investors are failing to acknowledge just how materially the story has changed. Starting from Q1-2021, all the way to our expected Q4-2023, the company’s AFFO will be flat. You have a 3 year timeframe of zero growth. You can scream from the cell phone tower tops about data usage increasing and you won’t get any arguments from us. But where is the growth in AFFO for AMT?
Outlook And Verdict
Organic billings actually had a solid showing and the 5.6% growth rate in Q1- 2023 was exceptionally good. The offset here is that the rolling off of the Sprint contracts has kept adjusted EBITDA under pressure. Rising interest expense (even accounting for higher interest earned on cash balances) has done the rest of the damage.
Q1-2023 Results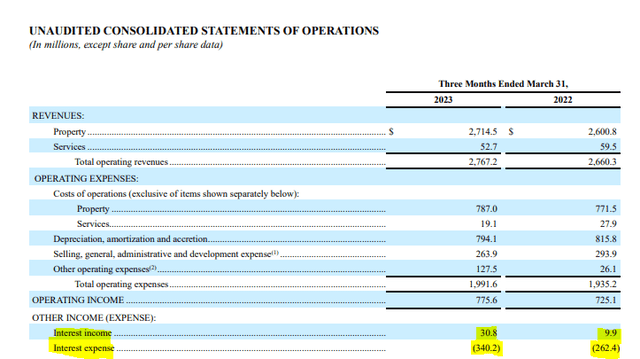
New site tenant billings were actually guided for 0% for 2023 in the US. Even international is expected at just 2% (was 13% in 2021).
Q1-2023 Results
Bears have often argued that technological advances and the move to 5G will allow carriers to use fewer traditional cell phone towers. We don’t necessarily buy that theory, but small cell deployment is likely to challenge the long term growth rate assumptions for AMT. AMT also overpaid massively for CoreSite. We generally think data centers are a poor story and Digital Realty Trust Inc. (DLR) is a prime example of how bad that story is. So that AMT acquisition likely acts as a bigger albatross around the growth story’s neck. What we are likely to see more than anything else is a selling climax where investors finally throw in the tower. We think at a minimum we will see the $150 mark as that happens.
You had AMT trade at a 14-15X multiple even when it was growing strongly. You had that happen in an era with pinned zero percent rates. You really believe that we won’t go there when risk-free rates are 5% and AMT has stopped growing AFFO for 3 years?
From a technical point of view, the stock had a major consolidation in the $140-$150 range for well over a year before it broke out and went on its growth sprint.
Stock Charts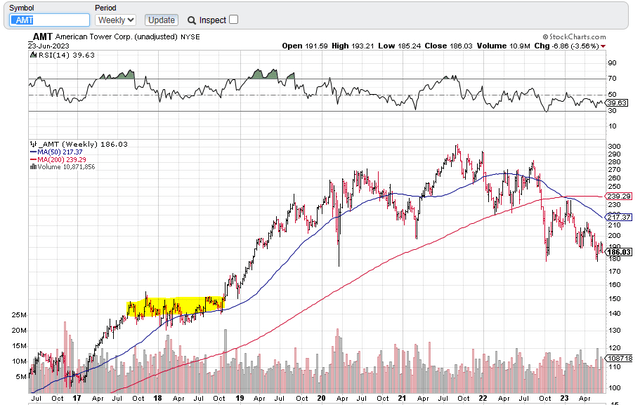
We think that zone will be challenged. AMT is still expensive at 19X AFFO, for a “no-growth” company. Crown Castle Inc. (CCI) which we wrote on recently, has broken to new 52 lows and trades at 14.3X AFFO multiple. It seems a matter of time before AMT joins that sub 15.0X multiple group. We are currently on the sidelines here and our pain-rating scale shows the company as fundamentally overvalued.
Author’s Pain Scale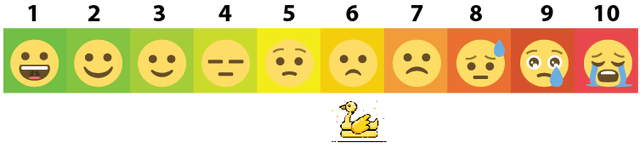
We would look to get involved near the $140 zone.
Please note that this is not financial advice. It may seem like it, sound like it, but surprisingly, it is not. Investors are expected to do their own due diligence and consult with a professional who knows their objectives and constraints.
Credit: Source link